What Can Stop This Stock Market Rally?
Stock-Markets / Stocks Bear Market Aug 28, 2009 - 01:09 AM GMTBy: Tim_Iacono
 You hear a lot of talk these days about what could possibly stop the current stock market rally given that we've clearly passed the "acute" phase of the financial crisis and, quite literally, there is no place to go but up for many economic indicators.
The term "statistical recovery" is bandied about quite a bit by doubters of the recent move up for equities and for many very good reasons such as the following:
• home prices seem to be going up when they're probably really still going down
• consumers have dramatically cut back on their spending but no one seems to care
• current quarter GDP will print at +2 or +3 percent but it is completely unsustainable
• bank balance sheets appear healthy when they are really still loaded with bad loans
But, none of this really seems to matter when you have a chart that looks like this.
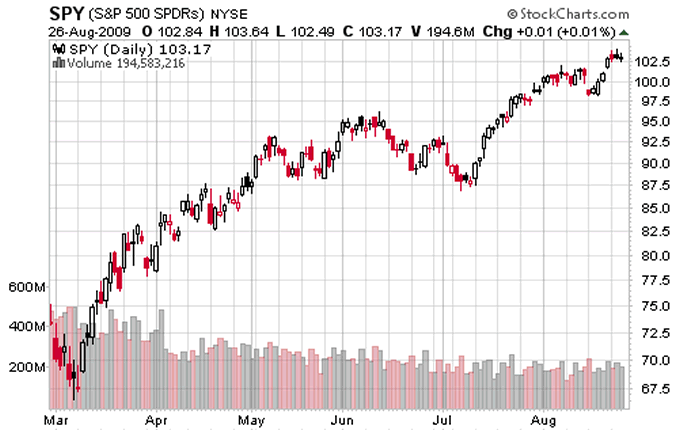
A 50+ percent move up over a period of five-and-a-half months will eventually make a believer out of almost anyone, a point that is proven again and again, day after day.
But, aside from some big new financial market brush fire developing somewhere that, having learned the lessons of 2008 well, the Treasury Department and Federal Reserve will no doubt quickly hose down with another few hundred billion dollars in money and credit (more if needed), is there anything out there on the horizon that might dampen the enthusiasm of the stock-buying public?
Well, the obvious one is housing.
While a growing number of pundits have all but declared the housing market healed, the latest evidence being offered the other day in the S&P Case Shiller Home Price Index, there is still clearly a ways to go before real estate stops being a drag on consumer psyches and far too many still believe that, somehow, we'll revert to our 2005 spendthrift ways.
There are millions of foreclosures still to come over the next year or two and most people seem all too willing to take their $8,000 tax credit and bid on a property, not seeming to know or care that home price bottoms are long drawn out affairs and that five percent 30-year fixed rates are the exception, not the rule.
As for the Case Shiller Home Price Index, as noted here previously, there's a pretty good chance that seasonal factors will result in the resumption of negative monthly price changes in another few months, though, with the sea-change in prices recently, anything could happen.
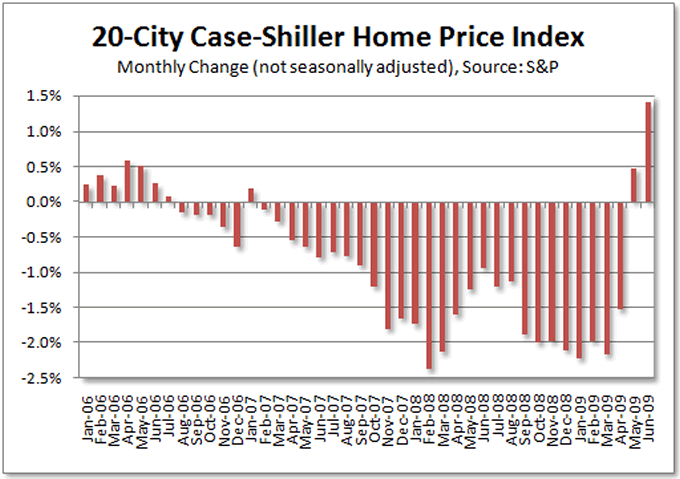
The reversal in home prices from a February-March decline of more than two percent to a May-June gain of almost 1.5 percent was the largest three-month swing in more than 20 years of data for the 10-city index - more than double the previous record.
Is that what's really happening in the housing market and, if so, how long can that possibly continue with the deluge of sellers that will now be entering the market, most importantly banks with their huge inventory of foreclosed homes?
Another month or two of rising home prices and then a swift return to negative numbers could dampen confidence very quickly later this year and millions of shareholders might realize that home prices have not yet hit bottom, despite the optimism everyone felt over the summer.
Turning to the labor market picture, it remains a bleak outpost where stock market bears can still gather to compare notes, however, it is not likely to scare off any bulls at this point.
Who would have thought that we'd ever "cheer" a quarter of a million jobs lost in just one month? But, that's what happened last month and it might happen again next week.
There is much more pain to come in the labor market but, from here on out, except for the low-profile, long-term unemployment statistics, it will continue to be a case of being "less bad" than what we've already seen.
In a world where "less bad is the new good", that's reason alone to bid stocks higher.
There is one thing, however, that could put the kibosh on investors' enthusiasm a few months down the road - inflation.
Inflation?
Hasn't inflation morphed into deflation - an annual rate of minus 2.1 percent as of July - and isn't everyone looking for consumer prices to be tame for the next year or two if, as it appears now, we are lucky enough to avoid that dreaded Great Depression malady of "de-flation"?
Surely, the now-docile CPI won't be spooking any shareholders this year.
Well, maybe it will...
Here's why.
Recall that the consumer price index breaks down into eight major categories as shown below, the two categories that contain energy costs - housing and transportation - both broken out into energy and non-energy components.
Here's the way things stand today, energy prices being the clear driver in the current negative annual rate of inflation which reached a 50+ year low last month.
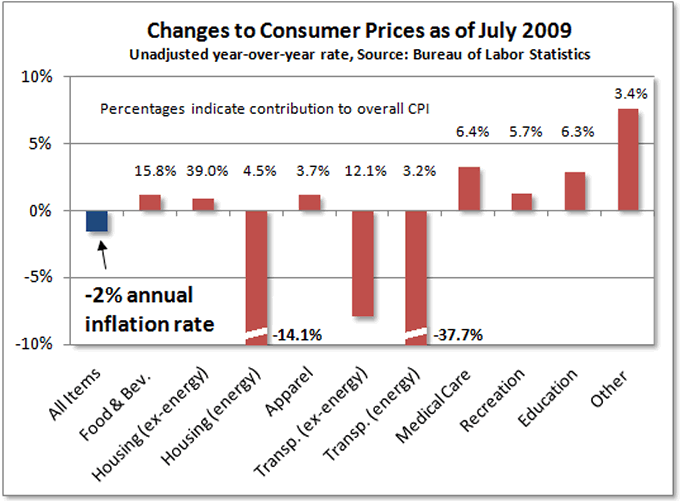
Notice that, even through the distortion of hedonic adjustments and other nefarious measures that the Bureau of Labor Statistics uses to ensure that prices don't rise too much, nearly all non-energy categories are still up from a year ago, some of them a lot.
Though economists may still favor the dubious "core rate" of inflation, it is the year-over-year change in the "overall" rate of inflation that garners all the headlines and elicits concerned looks from investors of all stripes.
So, what happens later this year when, instead of comparing energy prices against $140 crude oil or even $100 crude oil, energy costs are compared to $40 or $50 crude oil?
Well, it may not be pretty.
Even though all energy components account for less than eight percent of the overall index, they have quite a large impact on the headline figure when you get changes of 30, 40, 50 percent or more and, importantly, this works in both directions.
According to Energy Department data, U.S. gasoline prices reached a low at about $1.61 a gallon last December and stayed below $2 a gallon until the spring. Today's average retail price of $2.62 represents a whopping 63 percent increase over last year's low, a full 30 percent above the two dollar mark. With the prospect that crude oil prices may not go down and, perhaps, might just head toward $100 a barrel between now and the end of the year, this sets the stage for some surprisingly high inflation rates.
Keeping all other categories in the CPI unchanged from year-over-year readings and throwing in a healthy increase for heating oil, piped gas, and electricity (which is something of a stretch for natural gas prices, but, anything's possible these days), all of a sudden you come up with thre or four percent inflation again before Christmas, perhaps higher.
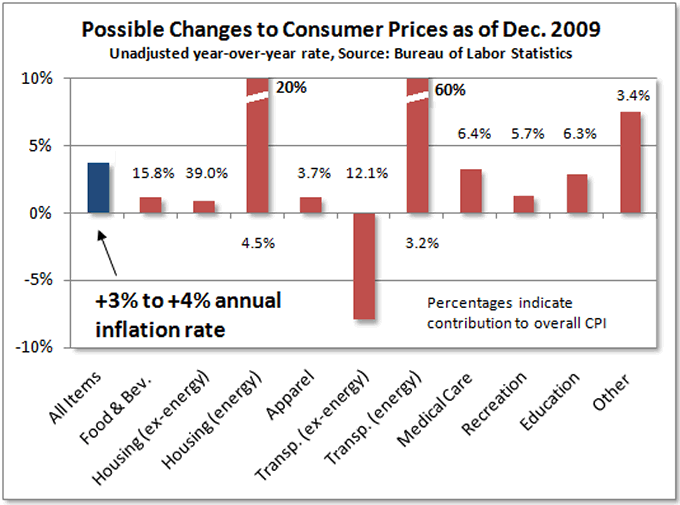
After the huge success of the Cash for Clunkers program, many now expect car prices to rise which could push that last red bar hanging below the x-axis into positive territory.
Now, I don't know about you, but it seems to me that inflation rates this high might set off all sorts of chain reactions in financial markets, especially with interest rates at zero percent and the Fed printing money furiously, and none of this is likely to be good for equity markets.
As the world learned painfully in the 1970s, stocks and inflation don't get along too well together and, while this surge in consumer prices might only last four or five months, it will nonetheless have the media talking about inflation again and those poor seniors who are getting no cost of living adjustments in their Social Security checks will again be calling their Congressmen to complain.
Believe it or not, a curve like the one you see below is quite possible as we enter 2010.
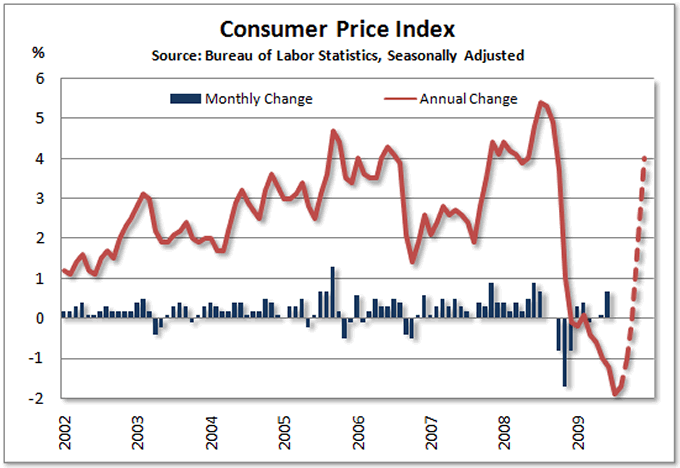
Now, the really bad news here is that, since the recent wave of liquidity has pumped up nearly every asset class, the price of oil is not likely to go down (making for tame inflation later this year) unless stock prices go down.
But, based on the much higher year-over-year rates of inflation that will show up later this year if oil prices do not go down, that, in itself may be enough to send the price of stocks down.
Either way, it looks like something has to go down.
By Tim Iacono
Email : mailto:tim@iaconoresearch.com
http://www.iaconoresearch.com
http://themessthatgreenspanmade.blogspot.com/
Tim Iacano is an engineer by profession, with a keen understanding of human nature, his study of economics and financial markets began in earnest in the late 1990s - this is where it has led. he is self taught and self sufficient - analyst, writer, webmaster, marketer, bill-collector, and bill-payer. This is intended to be a long-term operation where the only items that will ever be offered for sale to the public are subscriptions to his service and books that he plans to write in the years ahead.
Copyright © 2009 Iacono Research, LLC - All Rights Reserved
Tim Iacono Archive |
© 2005-2022 http://www.MarketOracle.co.uk - The Market Oracle is a FREE Daily Financial Markets Analysis & Forecasting online publication.


