


Commodity Trading Alert for GLD, SLV, UNG, USO ETFs
Commodities / Commodities Trading Aug 27, 2009 - 01:25 AM GMTBy: Chris_Vermeulen

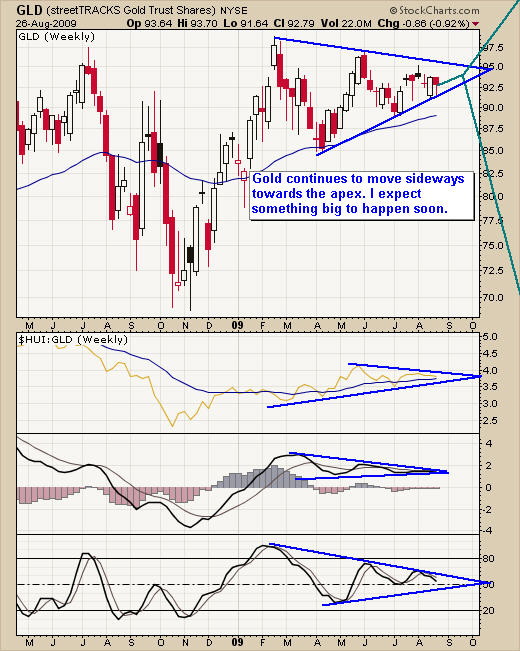
 GLD Gold Trading Fund – Weekly Chart
As you can see on this weekly chart gold has been consolidating for the past 5 months. This bullish pennant pattern is hinting that prices will breakout to the up side in the coming weeks. If for some reason we see the USD rally then I expect to see the price of gold move down as traders rush to sell their gold bullion. I continue to watch and wait for the next buy signal for gold.
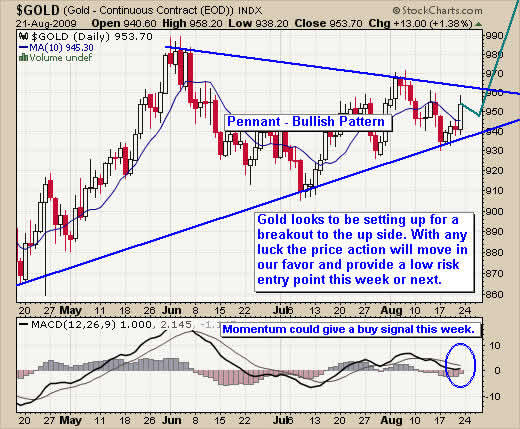
Below is a 4 month spot Gold chart
You can clearly see the pennant formation with gold nearing is apex. Soon enough spot gold prices are going to Blast off or Drop off. I continue to follow the charts closely as we near the apex for a low risk buy signal.
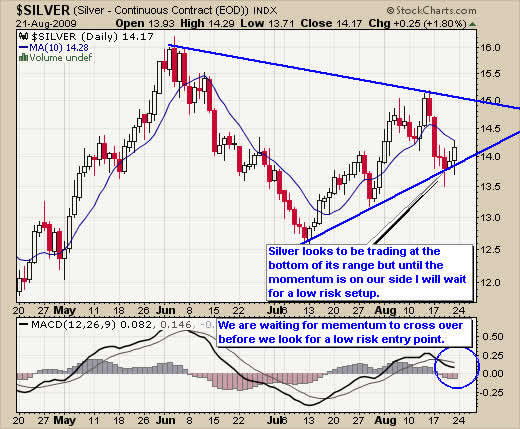
Below is a 4 month spot Silver chart
Spot silver price is forming a similar price pattern. Because spot silver is much more volatile the pennant is a little taller. Again we wait for a low risk setup.
Precious Metals Trading Conclusion: Precious metals are slowly working their way to the apex of their large multi month pennant formation. In the coming weeks or months I expect to see prices spike much higher with everyone dumping their money into the safe haven GOLD & SILVER.
OR
When spot silver and gold prices start to break down from these multi month pennants we investors will start withdrawing our funds from precious metals at a very fast rate sending prices down.
As always, I keep focused using my low risk-trading model, which helps to alleviate the emotional part of trading during a time like this. Knowing that my down side risk is generally under 3%, this allows me to stay calm and focused. When a trade goes against me, it is not damaging to my account and I review what I have done to be sure I followed my trading system as planned. Losing trades happens all the time in trading, as it’s just part of the game. Knowing this, accepting it and keeping losses minimal is what separates profitable traders from the not so profitable traders.
The Energy Sector
The Energy sector seems to be a mixed bag. The weakness of the US dollar has help to boost the price of oil. Currently crude oil is threatening to break above the June high which will most likely trigger a surge of speculate traders/investors for buy crude oil. If the US dollar does find support in the coming weeks we should see the price of oil slide back down to the $60 per barrel level.
Natural gas as most of you know from my weekly writings is not something I am drooling over yet. It was every exciting two months ago with the bullish breakout but we avoided getting caught in the whipsaw action because of my low risk entry rules which confirm short term strength before we put our money to work.
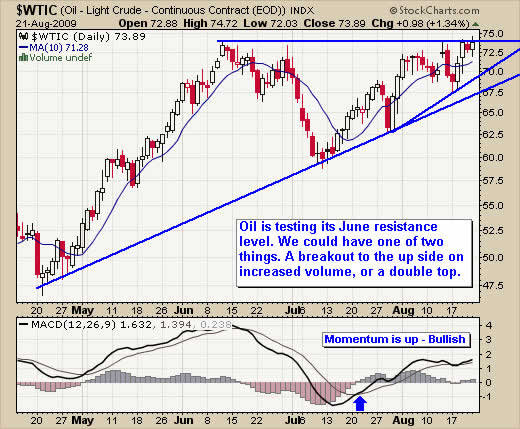
Below is a 4 month chart of the Crude Oil price
This chart clearly shows momentum is up and the price of oil trying to move higher as it trades at resistance of the June high. We are close to a possible low risk buy signal but depending on the price action this week will dictate what happens.
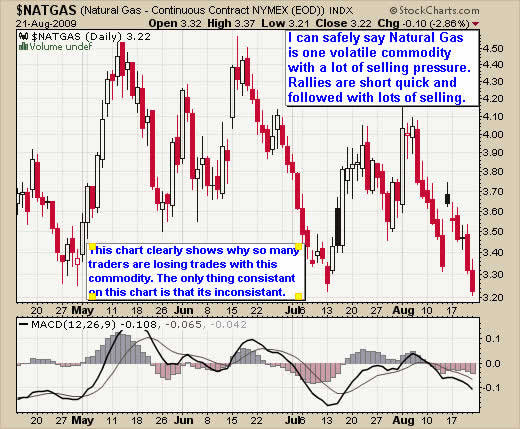
Below is a 4 month chart of the Natural Gas price
Natural gas I will say has on ugly looking chart. The only observation I can really get out of this is that gas is trading at the bottom of its trading range which is $3.30 area, and the top of the range is $4.20. This is a 27% trading range and could be a great small spec trade at this price level. This type of trade is for a high risk taking trader. I would like to see the price move sideways 1-2 more days here so I know its not making another leg lower from here.
Energy Trading Conclusion: There are several things which could happen here for oil and gas but in short my thought is if the US dollar continues to slide lower we will sell oil continue to rise and this will help boost natural gas prices some what. Because Nat Gas is at the low of its trading range there is a better chance we will see a higher price in the coming days for a small bounce. Natural gas has been underperforming the price of crude oil for 8 months which has happened in 2006 as well.
I continue to sit on the sidelines and watch the market unfold. Waiting is not the most fun but it is much better to wait than lose money on a bunch of high risk trades repeatedly.
Crude oil could have a low risk setup this week if all things work out. I am neutral on natural gas and not willing to jump on that rollercoaster.
Hello, I'm Chris Vermeulen founder of TheGoldAndOilGuy and NOW is YOUR Opportunity to start trading GOLD, SILVER & OIL for BIG PROFITS. Let me help you get started.
If you would like more information on my trading model or to receive my Free Weekly Trading Reports - Click Here
If you have any questions please feel free to send me an email. My passion is to help others and for us all to make money together with little down side risk.
To Your Financial Success,
By Chris Vermeulen
Chris@TheGoldAndOilGuy.com
Please visit my website for more information. http://www.TheGoldAndOilGuy.com
Chris Vermeulen is Founder of the popular trading site TheGoldAndOilGuy.com. There he shares his highly successful, low-risk trading method. For 6 years Chris has been a leader in teaching others to skillfully trade in gold, oil, and silver in both bull and bear markets. Subscribers to his service depend on Chris' uniquely consistent investment opportunities that carry exceptionally low risk and high return.
This article is intended solely for information purposes. The opinions are those of the author only. Please conduct further research and consult your financial advisor before making any investment/trading decision. No responsibility can be accepted for losses that may result as a consequence of trading on the basis of this analysis.
Chris Vermeulen Archive |
Commodity Trading Alert for GLD, SLV, UNG, USO ETFs
GLD Gold Trading Fund – Weekly Chart
As you can see on this weekly chart gold has been consolidating for the past 5 months. This bullish pennant pattern is hinting that prices will breakout to the up side in the coming weeks. If for some reason we see the USD rally then I expect to see the price of gold move down as traders rush to sell their gold bullion. I continue to watch and wait for the next buy signal for gold.
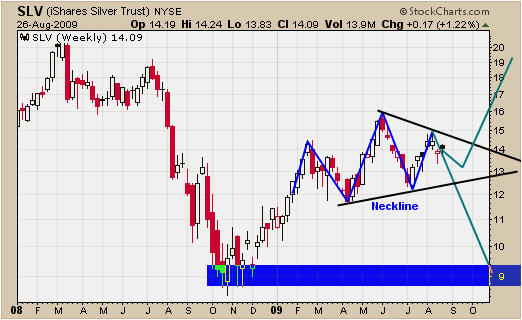
SLV Silver Trading Fund – Weekly Chart
Silver has two patterns forming here. The first is shown with the blue trend line which is a head & shoulders. This is a bearish pattern and points to much lower silver.
The second pattern is pennant using the black trend lines. This is a bullish pattern and points to higher prices. As you can see silver has much more time to consolidate before it reaches the apex. I continue to watch silver on the daily chart for an early buy signal.
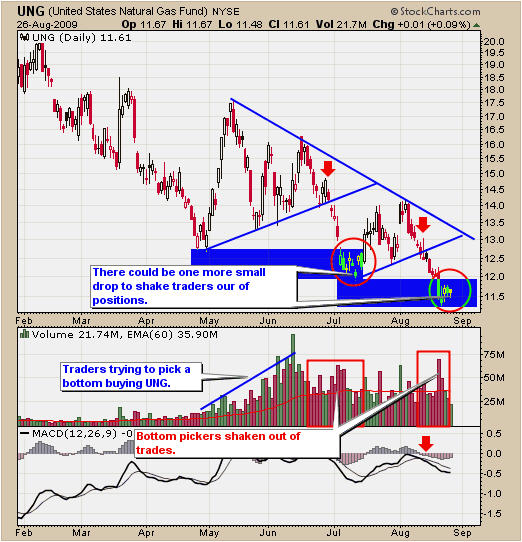
UNG Natural Gas Trading Fund – Daily Chart
Nat gas looks to be finding support at the $11.50 level. This could provide a great short term trade for those active traders looking to grab a quick 5-10% gain if the price starts to rally intraday. Overall natural gas has been trading down and sideways.
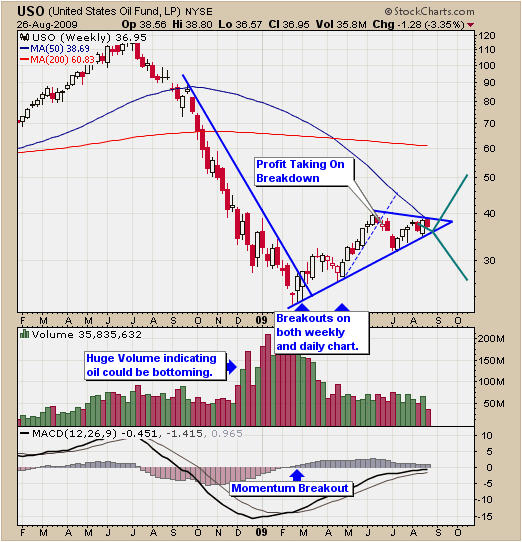
USO Crude Oil Trading Fund - Weekly Chart
Crude oil has a very nice looking chart. The bullish pennant is pointing to a much higher price. Currently the price is stuck under the June resistance level but appears to be holding up nicely. Any week now I expect to see a sharp rally or a sharp sell off. Let’s continue to watch the price unfold.
Technical Traders Conclusion:
The analysis above allows you to see that gold, silver and crude oil are all trading in a bullish pennant. I am watching the daily charts very closely for a buy signal. Waiting for my low risk buy signal is important because it confirms momentum and bullish price action before we put our money to work. These commodities could easily roll over and sell down quickly which is why I always follow my trading strategy to help avoid getting caught on the wrong side of the trade.
Natural gas is currently over sold in my opinion and ready for a bounce. If the price starts to move higher tomorrow (above Wednesdays high) then you could go long for a 1-5 day trade. There is a good chance it will provide 5-10% return, but be sure to take profits quickly as it is just a bounce (dead cat bounce). If the price drops below Wednesdays low then I would not be holding it any longer.
Hello, I'm Chris Vermeulen founder of TheGoldAndOilGuy and NOW is YOUR Opportunity to start trading GOLD, SILVER & OIL for BIG PROFITS. Let me help you get started.
If you would like more information on my trading model or to receive my Free Weekly Trading Reports - Click Here
If you have any questions please feel free to send me an email. My passion is to help others and for us all to make money together with little down side risk.
To Your Financial Success,
By Chris Vermeulen
Chris@TheGoldAndOilGuy.com
Please visit my website for more information. http://www.TheGoldAndOilGuy.com
Chris Vermeulen is Founder of the popular trading site TheGoldAndOilGuy.com. There he shares his highly successful, low-risk trading method. For 6 years Chris has been a leader in teaching others to skillfully trade in gold, oil, and silver in both bull and bear markets. Subscribers to his service depend on Chris' uniquely consistent investment opportunities that carry exceptionally low risk and high return.
This article is intended solely for information purposes. The opinions are those of the author only. Please conduct further research and consult your financial advisor before making any investment/trading decision. No responsibility can be accepted for losses that may result as a consequence of trading on the basis of this analysis.
Chris Vermeulen Archive |
© 2005-2022 http://www.MarketOracle.co.uk - The Market Oracle is a FREE Daily Financial Markets Analysis & Forecasting online publication.