Are the Bullion Banks losing their grip on Gold and Silver?
Commodities / Gold & Silver 2009 Aug 26, 2009 - 07:14 PM GMTBy: Peter_Degraaf
 “The Central Bank is an institution of the most deadly hostility existing against the Principles and form of our Constitution. I am an enemy to all banks discounting bills or notes for anything but coin. If the American people allow private banks to control the issuance of their currency, first by inflation, then by deflation the banks and corporations that grow up around them will deprive the people of all their property, until their children will wake up homeless on the continent their Fathers conquered.” - Thomas Jefferson.
(Charts courtesy Stockcharts.com)
In July 2008 the commercial gold traders (often referred to as the COT’s), were ‘net short’ 247,000 contracts. (This number is arrived at by deducting their total ‘long’ positions from their total ‘short’ positions). When this net short position gets high enough to satisfy them, (they were obviously happy with 247,000), they look for an opportunity to ‘cap a rally’, and then by selling heavily into the rally, they force hedge funds and margined traders to ‘cough up’ their long positions, so they can cover enough short positions to start the game over again. By September they were able to reduce their net short positions to 94,000 and they pocketed $250 per ounce in the process. Not bad for a 60 day effort.
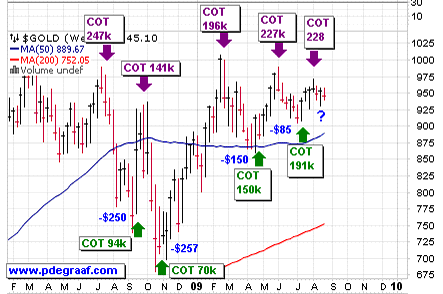
They repeated this between late September with 141,000 net short positions, and covered in November by bringing their total down to 70,000, and again made a nice profit of $257 per ounce.
Since then however, the pickings have become much slimmer ($150 in April and a measly $85 in July).
One wonders if perhaps too many people are finally catching on to the game and beating the commercials at their game, by buying gold before the COT’s have a chance to harvest what they had hoped to gain.
What if some Central Banks along with a few billionaires, together with a large number of small investors, began buying physical gold as they looked in horror at the profligate spending currently going on in Washington?
Recently I read that to get a grip on what a trillion dollars looks like, imagine a stack of one thousand dollar bills 63 miles high. If you topple the stack you can drive for about an hour before reaching the end. Now imagine driving for 9 hours to reach the 9 trillion dollar number that was just announced as the projected growth in the deficit for the next ten years, (and this number will no doubt be subject to upward revision as we go along).
This kind of ‘massive US dollar degradation’ has never happened before, and could well provide the motivation for a lot of people to increase their gold stashes, thereby denying the COT’s the gold they had hoped to scoop up.
The question mark on the above chart tells of the dilemma faced by the commercial traders. Historically (based on 35 years of trading history – thanks to www.mrci.com for this information), gold puts in a bottom late in August and then in September gold begins its annual Christmas rally.
The 7 – 8 week gold bottom was likely put in place on August 21st. The 36 week gold cycle was due to bottom on July 13th and appears to have coincided with the 7 – 8 week gold cycle bottom on July 21st.
If the commercials still hope to push the price down, they are running out of time. From recent E-mails that I have received, I am aware that many of my subscribers are sitting on cash, just waiting to participate in the fall rally.
On Monday August 24ththe Hulbert Financial Digest reported that the HGNSI ‘gold bullishness indicator’ had dropped to 3.8% (www.marketwatch.com). . This indicates that the vast majority of gold analysts are either neutral or bearish regarding gold at the moment. One surmises that most of these analysts are waiting for the COT’s to ‘do their thing’. Eventually the threat of the COT’s trying to cover their short positions is going to be a gold driver, as they are forced to cover while the market races ahead of them. This HGNSI report is the kind of news that we contrarians love to hear! It sets the stage for a price rise!
“A government big enough to give you everything you want is also big enough to take away everything you have.” - Thomas Jefferson.
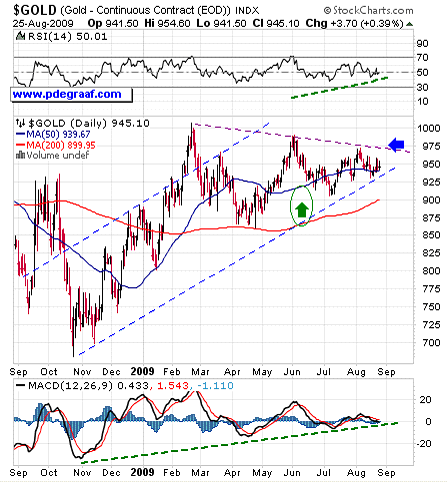
The daily gold chart shows gold coiling for a breakout. The supporting indicators are positive (green lines), and the 50DMA is in positive alignment to the 200DMA (green arrow). This leads to the conclusion that the coming breakout will be to the upside.
In my previous article dated July 15th I pointed to the importance of the ‘golden cross-over’, and in so doing was able to pick that last bottom.
”Everything predicted by the enemies of banks, in the beginning, is now coming to pass. We are to be ruined now by the deluge of bank paper. It is cruel that such revolutions in private fortunes should be at the mercy of avaricious adventurers, who, instead of employing their capital, if they have any, in manufacturing, commerce, and other useful pursuits, make it an instrument to burden all the interchanges of property with their swindling profits. Profits which are the price of no useful industry of theirs.” (1813) - Thomas Jefferson.
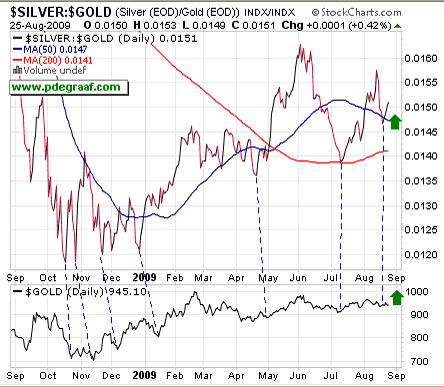
Featured is a chart that compares silver to gold with the gold price isolated at the bottom. When silver is outperforming gold (as now) it is usually indicative of both metals engaged in a bull market phase. Quite often when you see a bottom in this index you can pretty well count on a bottom occurring in gold. The dashed blue lines point to such coincidences. The two green arrows point to a happening (top arrow) and an expectation based on historical precedence (bottom arrow).
“When government fears the people, there is liberty. When people fear the government, there is tyranny.” - Thomas Jefferson.
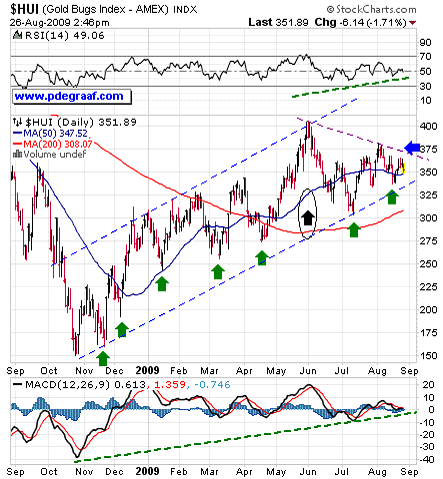
Featured is the HUI index of gold and silver stocks. The trend is decidedly upward bound. Each pullback ended up with a higher bottom than the previous bottom (green arrows). The two supporting indicators are positive (green lines). The 50DMA is in positive alignment to the 200DMA (black arrow). A breakout at the blue arrow starts the next bullish rally.
“An honest man can feel no pleasure in exercise of power over his fellow citizens.” - Thomas Jefferson.
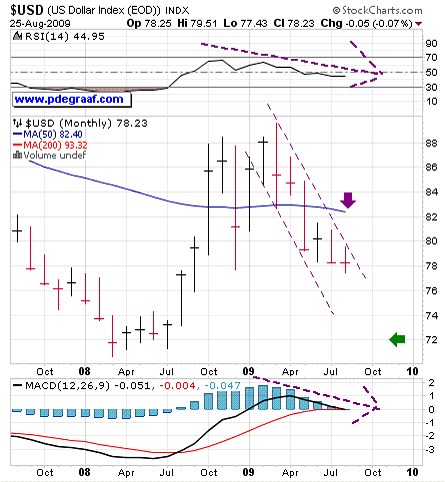
Featured is the monthly US dollar chart. Many gold and silver investors are spooked whenever the dollar rises. The trend is down towards the target at the green arrow. The RSI is down, so is the MACD. Even the 50 MMA is heading down (Thick purple arrow).
While the unexpected (a breakout at 80) is always possible, it would require a lot of buying of inflated dollars to make that happen). Most of the bars in the current six months old down-leg show the closing price at the bottom of the range. That is bearish.
“A democracy is little more than mob rule, where 51% of the people may take away the rights of the other 49%.” - Thomas Jefferson.
Summary: Look at almost any commodity commodity chart and you will see a pennant forming.
When you have that many pennant formations appearing all at once, odds are that the coming breakouts will happen in the same direction as the movement towards the pennant (in this case upward).
In the event that the commercials are able to cause one more forced bottom, be ready to jump in and get your gold before they can get theirs. Based on the chart evidence presented in chart one of this essay, have no fear of the COT’s! One day they will be your friend! Historically the longer a commodity is depressed in price the higher it will rise when the manipulation ends. This is due to the fact that increased production requires a rising price to provide incentive for the producer.
On my website you will find some interesting FREE features: “The Pick of the Week”, as well as a goodly number of long range charts.
A recent addition is a frequently updated essay: “My expectations for the future”.
The ‘Worthwhile Quotes’ collection makes for interesting and educational reading.
Happy trading!
By Peter Degraaf
Peter Degraaf is an on-line stock trader with over 50 years of investing experience. He issues a weekend report on the markets for his many subscribers. For a sample issue send him an E-mail at itiswell@cogeco.net , or visit his website at www.pdegraaf.com where you will find many long-term charts, as well as an interesting collection of Worthwhile Quotes that make for fascinating reading.
DISCLAIMER: Please do your own due diligence. I am NOT responsible for your trading decisions.
Peter Degraaf Archive |
© 2005-2022 http://www.MarketOracle.co.uk - The Market Oracle is a FREE Daily Financial Markets Analysis & Forecasting online publication.


