Options Implied Stock Prices Forward 30 Days Trend
Stock-Markets / Options & Warrants Aug 26, 2009 - 04:28 AM GMTBy: Richard_Shaw
 Options traders provide one community of opinions worth considering when evaluating short-term prospects for stocks. While they as a group could be totally wrong, they differ importantly from analysts and academics, because they are risking their money on their opinions.
It is mathematically possible to extrapolate the probable range of future prices through a specified period using the implied volatility of the near-term, “at the money” options associated with particular securities. We published the formula in a prior posting.
It is important to note that the probability ranges make no suggestion as to direction, just the level of variation from the market price either positively or negatively. Other information is needed to inform your opinion as to whether prices will move into the upper or lower section of the probability ranges.
Key US Stock Indexes:
The chart below computes the 68% and 95% probably price ranges (one and two standard deviations of implied volatility) for key US stock indexes out 30 days based on the implied volatility from published volatility indexes.

In short, the future prices changes over 30 days for the S&P 500 and NASDAQ 100 have a 68% probability of about 7%, and a 95% probability of about 14%. The Dow Jones Industrial Average has a somewhat narrower probable price range. The Russell 2000 small-cap index has a wider probability price range (about 9% and 18%).
Miscellaneous ETFs:
The next chart below utilizes the implied volatility of the near month Call option for the associated securities. Published volatility indexes are not available for those securities (with the possible exception of Japan, but we are not yet familiar with the Japan volatility index, so we didn’t use it).

The miscellaneous selection of ETFs in the chart above shows widely varying probability ranges for prices over the next 30 days.
China and Brazil have wider probability ranges than emerging markets overall, and US equity REITs have a yet wider range of probable prices than China and Brazil.
Japan has a comparatively low probable price range, as do long-term Treasuries. However, for a bond investor, the 4.7% to 9.3% range of 68% to 95% probable prices over the next 30 days for long-term Treasuries is quite large for fixed income securities.
Uses For Probable Price Ranges:
Two important potential uses for the probability price ranges are:
- thinking about stop loss points or percentages (setting stops outside of the ranges, if not greater than your absolute risk tolerance — or avoiding positions with probable price ranges outside of your risk tolerance)
- thinking about strike prices for selling covered calls (sell strikes outside of the ranges).
Certainly prices could move outside of the probability ranges (that’s why they are not 100% probability), but to the extent that odds are important to short-term decisions, implied volatility derived price probability ranges could be useful as one tool in an overall decision toolbox.
Relationship to Chart Support and Resistance:
Let’s look at how the volatility implied probable price ranges relate to graphical charts and some other kinds of clues to future prices.

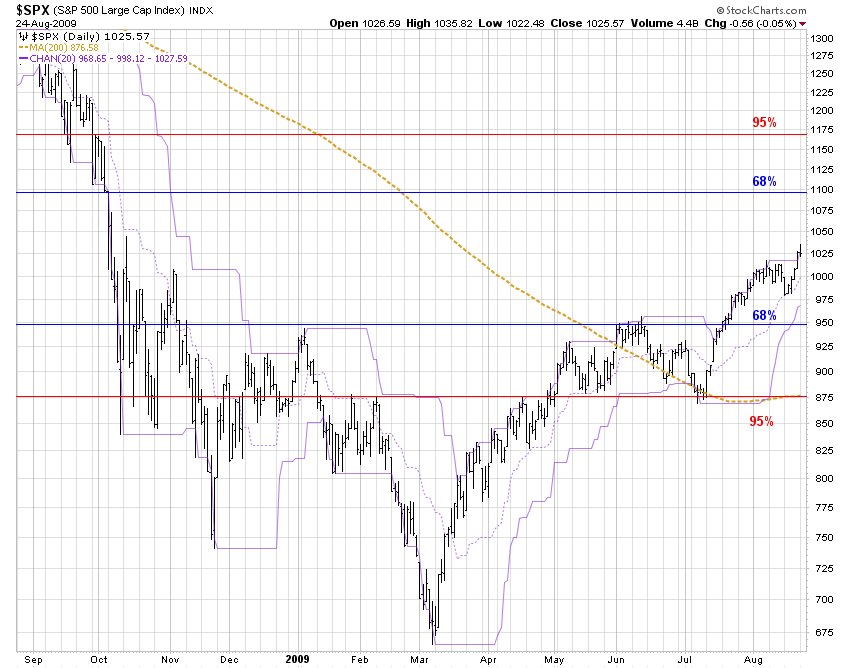
The upside 68% and 95% range would put the S&P 500 index back to the levels it experienced in mid-free fall during last October. There is no particular encouragement there, except for the investor who feels the crisis is over and that the near-death stage is past — that the 2008 summer, pre-crisis index price levels make sense today.
The downside 68% corresponds fairly closely to June-July, 20-day price channel highs, which could be seen as support levels. Those prices are also the approximate 20-day price channel highs in early January, which could also be seen as support levels.
The downside 95% corresponds to the July low which could be seen as a support level, and to the January/February double top, which could be seen as a support level.
Relationship to Fundamental Earnings Estimates:
Let’s look at how the volatility implied probable price ranges relate to fundamental estimates of price/earnings ratios:
Standard and Poor’s estimates 2010 12-month operating earnings on a bottom up basis to be $73.05. The 68% probability range would represent about 13 to 15 times 2010 operating earnings (average to somewhat below average). The 95% probability range would represent about 12 to 16 times 2010 operating earnings (well below average to above average).
Securities mentioned:
SPY, QQQQ, DIA, IWM, EFA, EEM, FXI, EWJ, EWZ, TLT, GLD, IYR.
Disclosure:
We own SPY, IWM, EFA, EEM, FXI, EWZ and GLD in some accounts.
By Richard Shaw
http://www.qvmgroup.com
Richard Shaw leads the QVM team as President of QVM Group. Richard has extensive investment industry experience including serving on the board of directors of two large investment management companies, including Aberdeen Asset Management (listed London Stock Exchange) and as a charter investor and director of Lending Tree ( download short professional profile ). He provides portfolio design and management services to individual and corporate clients. He also edits the QVM investment blog. His writings are generally republished by SeekingAlpha and Reuters and are linked to sites such as Kiplinger and Yahoo Finance and other sites. He is a 1970 graduate of Dartmouth College.
Copyright 2006-2009 by QVM Group LLC All rights reserved.
Disclaimer: The above is a matter of opinion and is not intended as investment advice. Information and analysis above are derived from sources and utilizing methods believed reliable, but we cannot accept responsibility for any trading losses you may incur as a result of this analysis. Do your own due diligence.
Richard Shaw Archive |
© 2005-2022 http://www.MarketOracle.co.uk - The Market Oracle is a FREE Daily Financial Markets Analysis & Forecasting online publication.


