Stock Markets Resumed their Five Month Uptrend
Stock-Markets / Financial Markets 2009 Aug 23, 2009 - 08:13 AM GMT After starting the week with a broad-based sell-off, stock markets resumed their five-month uptrend as investors’ confidence in the recovery prospects of the global economy gained traction. With risky assets back in favor, a number of bourses and crude oil closed at fresh highs for the year, showing resilience in the face of a sharp correction in China on Monday (-5.8%) and Wednesday (-4.3%). Safe-haven assets such as government bonds and the US dollar received a cold shoulder.
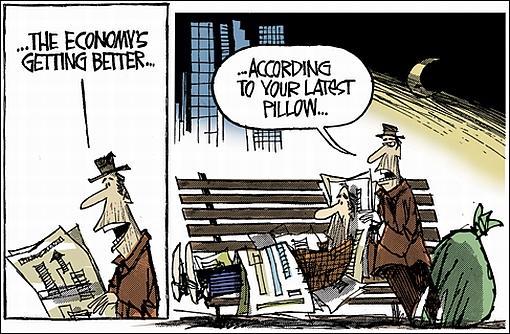
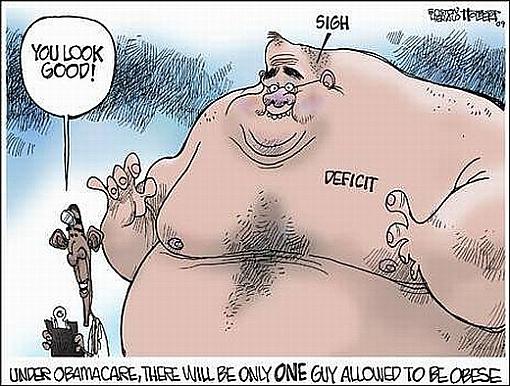
Source: Walt Handelsman, August 20, 2009.
Referring to the nascent economic recovery, Paul Kasriel and Asha Bangalore (Northern Trust) said: “There is concern being voiced that after the fiscal stimulus wears off, the economy will lapse back into a recession. Anything is possible, but that does not necessarily make it highly probable. In the post-WII era, once the US economy has gained forward motion, it has maintained that forward motion until the Federal Reserve has intervened to halt it.
“We believe that the earliest the Fed will begin to take action to brake the pace of nominal economic activity will be late-June of 2010. And if it begins to take action then, it will do so only tentatively. If, in fact, economic activity is flagging from a lack of additional fiscal stimulus, then the Fed is unlikely to commence tightening or would reverse course. We believe that the next recession, whenever it occurs, will be precipitated by the lagged effects of Fed tightening, not by the economy ‘running out of gas’ on its own.”
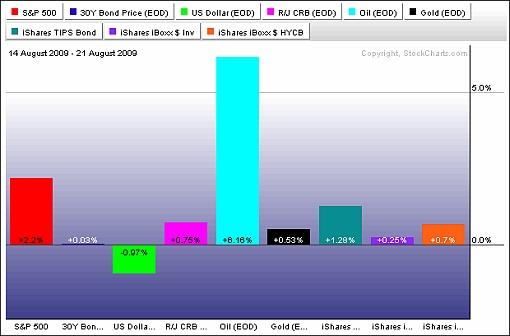
The past week’s performance of the major asset classes is summarized by the chart below - a set of numbers that indicates renewed investor appetite for risky assets.
Source: StockCharts.com
A summary of the movements of major global stock markets for the past week, as well as various other measurement periods, is given in the table below.
The MSCI World Index (+1.6%) and MSCI Emerging Markets Index (-0.8%) followed separate paths last week as China and a number of emerging markets came under pressure during the first few trading days. Emerging markets have now underperformed developed markets for three weeks running.
According to fund trackers EPFR Global (via the Financial Times), equity funds investing in China had their worst week since Q1 2008, while outflows from equity funds targeting global emerging markets and Asia ex-Japan recorded 24-week and year-to-date highs respectively.
Click here or on the table below for a larger image.
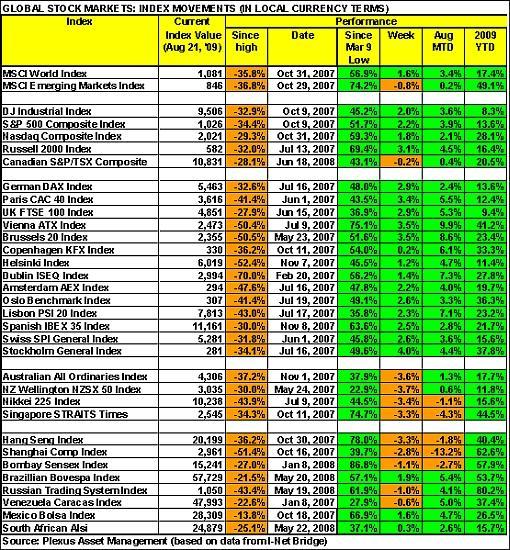
Top performers in the stock markets this week were Cyprus (+7.0%), Turkey (+6.5%), Greece (+5.9%), Poland (+5.9%) and Sweden (+4.2%). The top positions were all occupied by European countries where the region could emerge from recession sooner than previously expected. At the bottom end of the performance rankings, countries included Nigeria (-9.3%), Taiwan (-5.1%), Kyrgyzstan (-4.2%), Qatar (-4.0%) and Australia (-3.8%).
After surging by 90.7% since the beginning of the year to its peak on August 4, the Chinese Shanghai Composite Index plunged by 19.8% over the course of the following 11 trading days, but clawed back 6.3% during the last two days of the week as pundits realized that the tightening of monetary policy in China was not imminent. The Japanese Nikkei 225 Average (-3.4%) fell in tandem with the Chinese and other Asian markets.
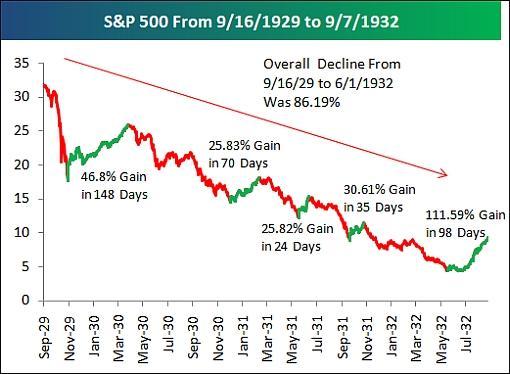
The S&P 500 Index, back above the psychological 1,000 level, has surged by 51.7% since the March 9 low. ”One argument the bears use is that we saw a number of similar bear market rallies that were this extreme during the overall 86% decline that the market saw from September 1929 to June 1932,” said Bespoke. ”However, as shown below, the current rally is now bigger and longer than any of the rallies seen during the 1929 to 1932 crash. The biggest rally during the ‘29 to ‘32 period was 46.8% over 148 days.”
Source: Bespoke, August 21, 2009.
Of the 94 stock markets I keep on my radar screen, 47% (last week 63%) recorded gains, 47% (33%) showed losses and 4% (4%) remained unchanged. (Click here to access a complete list of global stock market movements, as supplied by Emerginvest.)
John Nyaradi (Wall Street Sector Selector) reports that as far as exchange-traded funds (ETFs) are concerned, the winners for the week included SPDR S&P International Financial Sector (IPF) (+7.4%), iShares MSCI Turkey (TUR) (+7.2%), Market Vectors Environmental Services (EVX) (+6.7%), United States Oil (USO) (+6.1%) and iShares US Oil Equipment and Services (+6.0%) .
At the bottom end of the performance rankings, ETFs included United States Natural Gas (UNG) (-9.1%) (natural gas prices dropped to a seven-year low on worries about a supply glut), PowerShares Preferred Financial (PGF) (-7.8%), Market Vectors Solar (KWT) (-5.9%) and Claymore/MAC Global Solar Energy (TAN) (-5.5%).
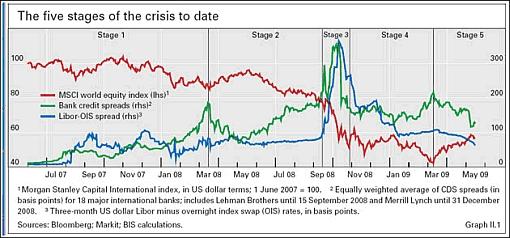
On the credit front, the chart below comes from the annual report of the Bank for International Settlements (via Casey’s Daily Dispatch) and shows that the crisis has developed in five distinct stages. Stage five, beginning in March 2009, shows the rally in the MSCI World Index (red line), as well as the significant improvement in the LIBOR-OIS (overnight index swap) spread (blue) and the CDS spread of 18 international banks (green) - heading towards the pre-crisis levels.
Source: Casey’s Daily Dispatch, August 22, 2009.
Other news is that the US government’s popular “cash-for-clunkers” car sales incentive program has burnt through most of its $3 billion funding in just one month and will come to an end on Monday, August 24. Meanwhile, the Federal Deposit Insurance Corp (FDIC) seized the Guaranty Bank of Austin on Friday, bringing the tally of US bank failures in 2009 to 81.
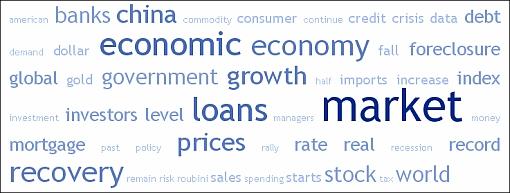
Next, a quick textual analysis of my week’s reading. The usual suspects such as “market”, “economy”, “loans” and “China” featured prominently. Interestingly, “recovery” has for the first time since the start of the credit crunch entered the tag cloud.
Referring to the stock market rally that is exceeding most expectations, the quote du jour this week comes from Brian Wesbury and Robert Stein of First Trust Advisors who wrote as follows in Forbes: “The way we see it, those who were pessimistic about stocks and the economy early this year are going through the classic five stages of grief. First, they denied a recovery was going to happen anytime soon. Then they lashed out with anger at those who spotted signs of the recovery. Now, they are bargaining, admitting the existence of the recovery that they did not see coming, but belittling it. Next, as things keep moving up, we can expect them to get depressed. We don’t expect acceptance to fully set in until late next year.”
Not everybody is in agreement with Wesbury and Stein, as gathered from David Rosenberg’s latest research report (Gluskin Sheff & Associates), saying: “Econometric models we ran show that the S&P 500 has 4.0% real GDP growth priced in … Now at the stock market bottom in March, the S&P 500 was priced for -2.5% real GDP, which is exactly what we are going to get this year, so the notion that the S&P 500 was egregiously undervalued back at 666 does not bear up to scrutiny. At the time, that level was completely realistic in light of the macro outlook.”
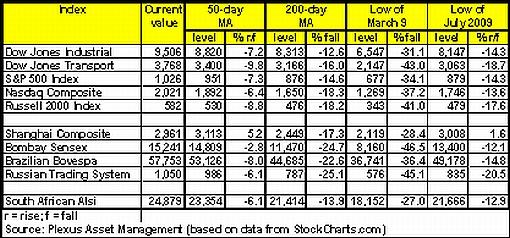
The key moving-average levels for the major US indices, the BRIC countries and South Africa (where I am based) are given in the table below. With the exception of the Chinese Shanghai Composite Index, which fell below its 50-day moving average just more than a week ago, all the indices are trading above their respective 50- and 200-day moving averages. The 50-day lines are also in all instances above the 200-day lines and therefore not threatening the bullish “golden crosses” established when the 50-day averages broke upwards through the 200-day averages.
The short-term support levels for the major US markets are as follows: Dow Jones Industrial Index (9,135), S&P 500 Index (980) and Nasdaq Composite Index (1,931).
Click here or on the table below for a larger image.
“The end game for this bullish phase [on stock markets] needs to be considered well before the event. While the timing is largely guesswork at this stage, the usual causes are not. Bull markets are usually assassinated by tighter monetary policy,” said David Fuller (Fullermoney) from across the pond.
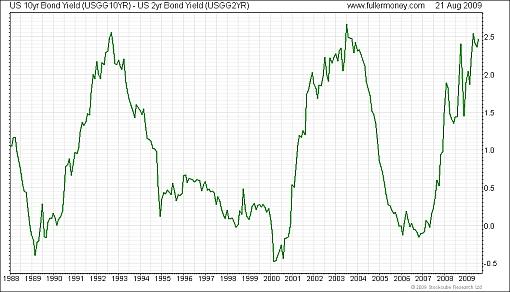
“A good, although not precise, indicator of bear market risk will be provided by the yield curve, currently showing the premium of US 10-year over 2-year government yields. Years often go by before this chart shows anything important but it should not be forgotten by any of us. When this next approaches 0.0, we should have at least trailing stops, mental or actual, for all of our equity long positions. When it inverts to negative, indicating that 2-year rates are higher than 10-year rates, and the longer it stays negative, the more we should assume that a bear market is approaching.
Source: Fullermoney.com
“The good news today, is that the next inverted yield curve is probably years away. Consequently, it would most likely take a true ‘black swan’ to derail the current bull market anytime soon. These are unpredictable by definition so I would not worry about them without evidence of a game-changing event. Meanwhile, setbacks in response to normal ‘wall of worry’ market volatility can be regarded as buying opportunities in favored assets,” concluded Fuller.
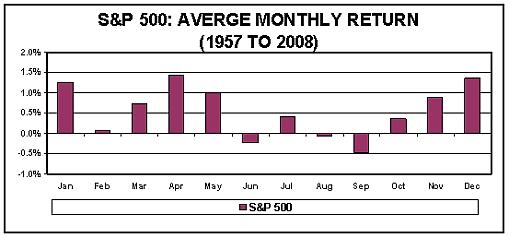
I have discussed valuation levels and technical indicators in my recent posts (see below), but another factor that will come into play is seasonality turning negative. Focusing on the S&P 500, I have done a short analysis of the historical pattern of monthly returns for this index from 1957 to mid-2009. The results are summarized in the graph below.
Source: Plexus Asset Management (based on data from I-Net Bridge)
If one looks at the average return per month and in which months the most market declines have occurred, it seems as if the months of June, August and September are traditionally bad for stock markets. Although June this year played according to script, with the S&P 500 showing a zero return, July excelled with a 7.4% gain. August (+3.9%) is comfortably ahead of the norm but, given the overbought level of markets, it is conceivable that the “bad” month of September - over time the month with the lowest average monthly return - might conform to the historical pattern.
For more discussion on the direction of financial markets, see my recent posts “Exit strategy of central banks vs stock market strategy“, “Rosenberg: The recession is dead, long live the recession!“, “Stock markets ripe for correction, but …“, “Charles Kirk: 10 powerful trading rules” and “Global stock markets - pop ‘n drop“. (And do make a point of listening to Donald Coxe’s webcast of August 21, which can be accessed from the sidebar of the Investment Postcards site.)
Economy
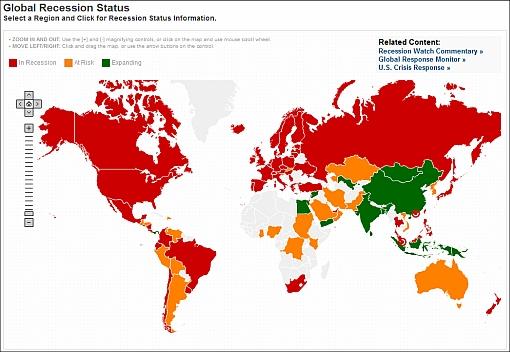
The Recession Status Map below, courtesy of Dismal Scientist Economy.com, aggregates growth statistics from around the world and allows one to see at a glance which economies are in recession, at risk or beginning to recover. Click on the map to link to the interactive version.
Source: Dismal Scientist
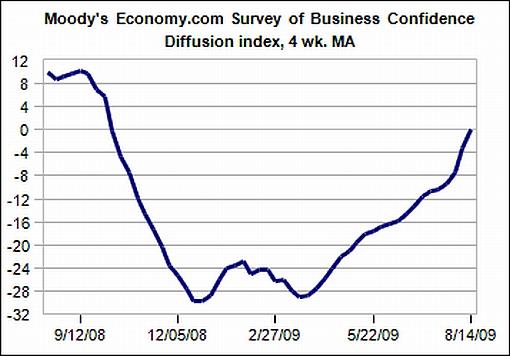
“Global business confidence remained positive last week for the second straight week. The last time confidence was consistently positive was nearly a year ago,” said the latest Survey of Business Confidence of the World by Moody’s Economy.com. (The chart below uses a four-week moving average and is therefore not yet reflecting the break above the zero line.) Businesses are responding most positively to broad assessments of the current economic environment and the outlook into early 2010; they are as strong as they have been since the financial crisis first hit in the summer of 2007. The Survey results suggest that the global recession is coming to an end, but isn’t quite over yet.
Source: Moody’s Economy.com
According to MarketWatch, Olivier Blanchard, the top economist for the International Monetary Fund, said on Tuesday the global recession was over and a recovery had begun. “The turnaround will not be simple. The crisis has left deep scars, which will affect both supply and demand for many years to come,” Blancard wrote in an article released by the IMF. He said growth was still highly dependent on government stimulus from fiscal and monetary policies and sustainable growth “will require delicate rebalancing acts, both within and across countries.”
Japan last week emerged from recession (not yet reflected on the map above), with its economy growing by 0.9% in the three months to June, marking the first expansion in five quarters on the back of private consumption, net exports and government stimulus spending. After the worst quarter on record, Hong Kong also returned to growth in Q2 2009, expanding 3.3% quarter on quarter.
The eurozone composite Purchasing Managers Index rose to a 15-month high of 50 in August from 47 in July - the biggest monthly increase on record. The 50 level separates expansion from contraction and the strong improvement seems to indicate that the eurozone could emerge from recession in the third quarter.
A snapshot of the week’s US economic reports is provided below. (Click on the dates to see Northern Trust’s assessment of the various data releases.)
Friday, August 21 • Sales of existing homes advance, inventories flat, and prices falling less rapidly
Thursday, August 20 • Initial jobless claims edge up for second consecutive week - it’s not unusual
Wednesday, August 19 • None
Tuesday, August 18 • Home construction is recovering, albeit at a slow pace • Wholesale prices of food, energy and core items fall in July
Monday, August 17 • Senior Loan Officer Opinion Survey - small positive signals but several aspects remain bothersome • Housing Market Index shows noteworthy improvement • Japan - the end of the latest recession?
The global economy is now beginning to emerge from its worst crisis in generations, but the downturn might have been much worse if central banks hadn’t acted so forcefully last fall, Federal Reserve Chairman Ben Bernanke said on Friday in a speech at the Kansas City Fed’s annual retreat in Jackson Hole, as reported by MarketWatch.
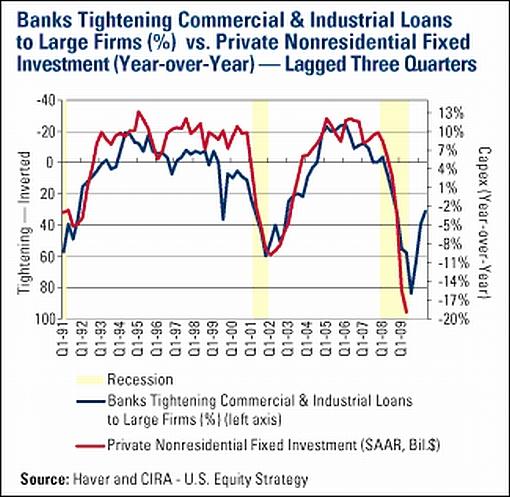
The chart below, courtesy of US Global Investors, shows the results of the Fed’s Senior Loan Officer Opinion Survey. An inverted scale is used, i.e. when the percentage of banks tightening their lending standards increases, the line trends down and vice versa. As indicated, the trend in lending standards has historically been closely correlated with the year-on-year change in private non-residential fixed investment, or capex, lagged by three quarters.
The lending standards data for July were released last week and show that a net 31.5% of large banks were tightening their lending criteria versus a net 83.6% last October, resulting in the line trending up. Based on the historical relationship, one would expect capex to start rising soon. Although not shown, the research also indicates a similar correlation between lending standards and both industrial production and total non-farm employees, implying these should also soon start trending up.
Source: US Global Investors - Weekly Investor Alert, August 21, 2009.
Dampening some of the enthusiasm, Nouriel Roubini (RGE Monitor) said (via Forbes): “I now anticipate that policy measures and other factors will boost real GDP growth, albeit in a temporary manner, in the second half of 2009. Yet the shape of the recovery (will it be V, U or W?) and other challenges will influence the US economic outlook going forward. Growth will remain well below potential in 2010, while the shape of the recovery will be closer to a U.”
The US economic data reports for the week include the following:
Monday, August 24 • None
Tuesday, August 25 • Consumer confidence • S&P/Case-Shiller Home Price Index
Wednesday, August 26 • Durable goods orders • New home sales
Thursday, August 27 • Initial jobless claims • Q2 GDP
Friday, August 28 • Personal income and spending • Core PCE • Michigan Sentiment Index
Markets
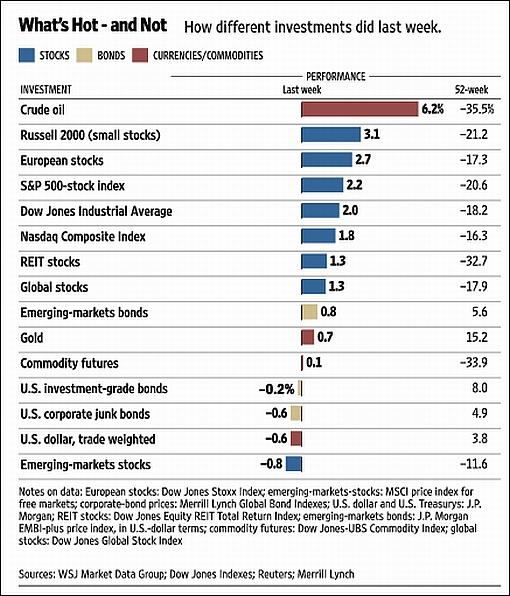
The performance chart obtained from the Wall Street Journal Online shows how different global financial markets performed during the past week.
Source: Wall Street Journal Online, August 21, 2009.
“Some people are addicted to seeing catastrophe in the future,” said the late Peter Bernstein, author of Against the Gods, The Remarkable Story of Risk. Let’s hope the news items and quotes from market commentators included in the “Words from the Wise” review will assist Investment Postcards readers to go about investment decision in a level-headed manner and steer away from excessive pessimism (or extreme optimism).
For short comments - maximum 140 characters - on topical economic and market issues, web links and graphs, you can also follow me on Twitter by clicking here.)
That’s the way it looks from Cape Town (where I’m making final arrangements to take a group of local business people to Slovenia in ten days’ time - let me know if you would like to meet with us in Ljubljana).
Source: Jerry Holbert
Nouriel Roubini (Forbes): Stop asking when the recession will end “A number of economic and financial variables have exhibited signs of improvement recently even if macro indicators are still mixed. The pace of economic deterioration has slowed significantly and, after four quarters of severe contraction in economic activity, I now forecast that the US will display positive real GDP growth in the second half of 2009. However, that does not mean that the recession in the US is already over, as many analysts have argued.
“Indeed, all the variables used by the National Bureau of Economic Research (NBER) to date recessionary periods will continue to contract or display subpar growth. However, I now anticipate that policy measures and other factors will boost real GDP growth, albeit in a temporary manner, in the second half of 2009. Yet the shape of the recovery (will it be V, U or W?) and other challenges will influence the US economic outlook going forward. Growth will remain well below potential in 2010, while the shape of the recovery will be closer to a U.
“Some of the so-called ‘green shoots’ observed in the economy in recent months can be defined as green shoots only if compared with the economic picture painted at the beginning of the year. The contraction in some indicators, such as industrial production, is still comparable to the recessions in the 1970s and 1980s. The July 2009 employment report displayed ‘only’ 247,000 nonfarm payroll losses - hardly qualifying as a green shoot in any other postwar recession. However, given how close the US was to entering a depression, even 250,000 payroll losses seem capable of cheering up investors.
“In the second half of 2009, as the economy bottoms out from a record contraction (the worst in the last 60 years), adjustments, such as slower inventory destocking, will occur, while policy measures such as ‘cash for clunkers’ will boost auto production and induce continued spending brought on by the stimulus. These factors will likely bring US real GDP growth back to positive territory in the third quarter of 2009. However, the NBER is not likely to call the end of the recession until at least late 2009 or early 2010. In addition to GDP growth, the NBER looks at four variables in making recession calls: real personal income less transfer payments; real manufacturing and wholesale-retail trade sales; industrial production; and payroll employment.
“While all of these indicators might perform better in the second half of 2009 than in the first, they are likely to remain in contraction or register subpar growth. With the labor market now a leading indicator for the recovery in private consumption and the wider economy, trends in payrolls will definitely influence the NBER’s call.”
Click here for the full article.
Source: Nouriel Roubini, Forbes, August 20, 2009.
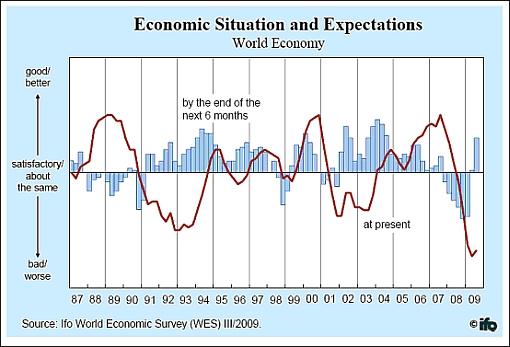
IFO: Clear Improvement in the Ifo World Economic Climate “The Ifo World Economic Climate Indicator rose in the third quarter of 2009 for the second time in succession. The rise in the indicator was primarily the result of the clearly more favourable expectations for the coming six months. But also the appraisals of the current economic situation have improved slightly for the first time since the third quarter of 2007.
“The economic expectations in North America and Asia are particularly optimistic. But also in Western Europe, Russia and Latin America, the expectations for the coming six months have again been revised upwards. In contrast, the economic expectations in most of the countries of Central and Eastern Europe remain negative albeit somewhat improved over the previous quarter.
“In contrast, the current economic situation is assessed as definitely unfavourable in all major regions. In the euro area, Central and Eastern Europe and Russia, the current economic situation has been even assessed as somewhat worse.
“The inflation expectations for 2009 are clearly lower, on a world average, than the inflation expectations for the previous year (2.5% vs. 5.4%). According to the expectations of the World Economic Survey (WES) participants, price increases in the course of the coming six months will stabilise around the currently low level. On average for the world, neither a boost in inflation nor a slide into deflation is foreseen.
“Short-term central bank rates will remain at current low levels over the next six months, in the opinion of the WES experts. In accord with the more favourable economic prospects, the WES experts anticipate that the long-term interest rates are likely to rise in most countries over the coming six months.
“The euro is regarded as slightly overvalued by the WES experts, on a world average. The other major world currencies, the US dollar, the Japanese yen and the British pound, in contrast are viewed as nearly properly valued.”
Source: IFO, August 19, 2009.
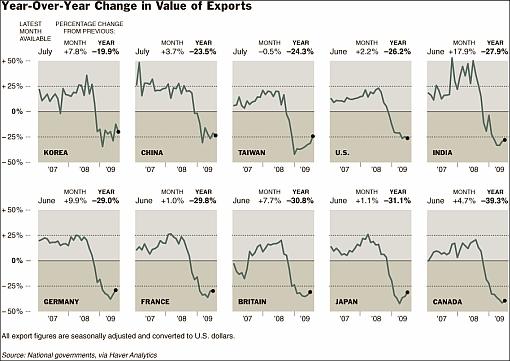
The New York Times: Hints of a rebound in global trade “World trade, which virtually collapsed last fall, appears to be starting to recover. But the rebound so far is small, providing little evidence that the world economy is about to start growing at a good pace.
“The United States reported this week that its exports in June were up 2.2% from the previous month. It was the first time in a year that exports had risen for two consecutive months.
“As the accompanying chart shows, most countries are now seeing an increase in trade, but volumes remain far below those of a year ago. To offset currency swings, all figures are based on the dollar volume of exports, not adjusted for inflation.
“In the credit crisis that grew severe last fall, both industrial production and world trade fell off much faster than final sales to consumers. That has set the stage for a recovery in trade even if there is none in consumer demand, as shipments are adjusted to final demand.
“There is a good chance that exports, particularly those directed to the United States, will pick up significantly over the next few months, as many industries restock inventories. That will especially be true for the automobile industry, which was surprised by the success of the ‘cash for clunkers’ program.
“China, which is among the first countries to report its trade figures each month, disclosed its July figures this week, showing a 3.7% gain on a seasonally adjusted basis. The American share of Chinese exports rose to its highest level since before the recession began, providing a sign that American figures for July will start to show larger gains in imports.”
Source: Floyd Norris, The New York Times, August 14, 2009.
Financial Times: Central bankers hold to a sober view “Central bankers from around the world gathered for the US Federal Reserve’s annual retreat in Jackson Hole, Wyoming, on Thursday amid a tug-of-war in the markets as to the prospects for global economic recovery.
“Over the past month, stocks and other risky assets worldwide have soared in value following stronger second-quarter growth than expected in many economies and some survey measures that raised hopes of a relatively vigorous, V-shaped rebound.
“The recovery of lost stock market wealth and broader easing of financial conditions promises to reinforce the growth outlook through a virtuous circle of financial and economic improvement.
“However, in recent days a pullback in Chinese bank lending and weak US consumer confidence and retail sales figures revived concerns about the market running ahead of itself.
“For the most part, central bankers appear to be taking a sober view and sticking to their forecasts of a long and slow climb out of the deep trough in economic activity.
“At issue is whether the near-term ‘upside surprise’ - a sharp rebound in Asia, better-than-expected growth in France and Germany, recovering trade flows, a swing in inventory accumulation and a spike in car production - changes much beyond what is now likely to be a strong third-quarter this year.
“Central bankers appear sceptical. Axel Weber, president of the Bundesbank, told Die Zeit this week: ‘I am not convinced that the recovery is sustainable yet and that the economy is capable of carrying itself.’
“Central bankers see the improvement in markets as significant, but note that the financial system still relies on government support and that banks remain under pressure, and are still cautious about lending.
“Final demand from consumers and businesses in the main industrialised economies remains very weak - particularly excluding the one-off effects of car-buying incentives.
“Many officials see some risk of inflation falling too low, with economic activity and capacity utilisation, including employment, still at very low levels.”
“However, there is clearly some risk that the recovery does indeed turn out to be more vigorous and sustained - and spare capacity less abundant - than the world’s central banks anticipate.
“This creates a dilemma for policymakers, who may wish to signal that they still do not expect to raise interest rates for quite some time, to prevent market interest rates from rising prematurely, but also want to retain flexibility to respond to data about the recovery.
“Particularly in the emerging world, there is also a concern that today’s stimulus could end up inflating asset price bubbles and laying the seeds of future financial instability.”
Source: Krishna Guha, Financial Times, August 20, 2009.
MarketWatch: We saved the world from disaster, Fed’s Bernanke says “The global economy is now beginning to emerge from its worst crisis in generations, but the downturn might have been much worse if central banks hadn’t acted so forcefully last fall, Federal Reserve Chairman Ben Bernanke said Friday.
“In a speech at the Kansas City Fed’s annual retreat in Jackson Hole, Wyo., Bernanke summarized a hellish year and explained modestly how he and his central bank colleagues saved the world from a bigger disaster. Read his full remarks.
“‘The world has been through the most severe financial crisis since the Great Depression,’ he said. ‘As severe as the economic impact has been, however, the outcome could have been decidedly worse.’
“If the Fed, other central banks and other government leaders hadn’t acted in a coordinated and aggressive way in September and October of 2008, ‘the resulting global downturn could have been extraordinarily deep and protracted,’ Bernanke said.
“Bernanke spoke to a selected group of top policy makers and economists. His speech, however, was aimed at a much wider audience: The president, the Congress and a public that’s angry and confused.
“Bernanke’s term as chairman of the Fed runs out in January, and the financial world is watching to see if President Barack Obama reappoints Bernanke or hands to job to someone else.
“Past financial panics have exacted an ‘enormous toll in both human and economic terms,’ Bernanke said. ‘In this episode, by contrast, policymakers in the United States and around the globe responded with speed and force to arrest a rapidly deteriorating and dangerous situation.’
“The policy response ‘averted the imminent collapse of the global financial system, an outcome that seemed all too possible to the finance ministers and central bankers’.”
Source: Rex Nutting, MarketWatch, August 21, 2009.
MoneyNews: Buffett - congress must cut spending “Billionaire investor Warren Buffett said the US economy has avoided a meltdown and appears on a slow path to recovery, but Congress must now deal with enormous amounts of debt that threaten to erode US purchasing power.
“In an opinion column published on Wednesday by the New York Times, Buffett wrote that he ‘resoundingly applauds’ actions by the Federal Reserve and the Bush and Obama administrations to pump trillions of dollars into the financial system.
“But the ‘gusher of federal money’ has run up a high level of debt that could fuel inflation, he said.
“‘The United States economy is now out of the emergency room and appears to be on a slow path to recovery,’ Buffett wrote.
“‘But enormous dosages of monetary medicine continue to be administered and, before long, we will need to deal with their side effects. For now, most of those effects are invisible and could indeed remain latent for a long time. Still, their threat may be as ominous as that posed by the financial crisis itself.’
“Buffett, who runs insurance and investment company Berkshire Hathaway Inc, likened the economic threat of ‘greenback emissions’ to the environmental threat of greenhouse gas emissions, leaving the United States with a deficit of $1.8 trillion or 13% of gross domestic product this year.
“In July, the government posted a $180.68 billion monthly budget deficit, a record for July, marking only the third time in the past 30 years that the government ran a deficit for 11 months in a row.
“Buffett said a revived economy will not be able to generate enough revenues to bridge the gap between outlays and receipts, so changes in taxes and spending will be required.
“Politicians will not likely have the will to raise taxes or slow spending, so they may opt to quietly let inflation increase, a move that will ‘confiscate’ wealth and allow the United States to evolve into a ‘banana republic economy’, he said.
“‘Our immediate problem is to get our country back on its feet and flourishing - a ‘whatever it takes’ still makes sense,’ Buffet said in the paper.
“But once recovery is gained, Congress must end the rise in the debt-to-GDP ratio and keep its growth in obligations in line with its growth in resources, he wrote.
“‘Unchecked carbon emissions will likely cause icebergs to melt. Unchecked greenback emissions will certainly cause the purchasing power of currency to melt. The dollar’s destiny lies with Congress,’ he said.”
Source: MoneyNews, August 19, 2009.
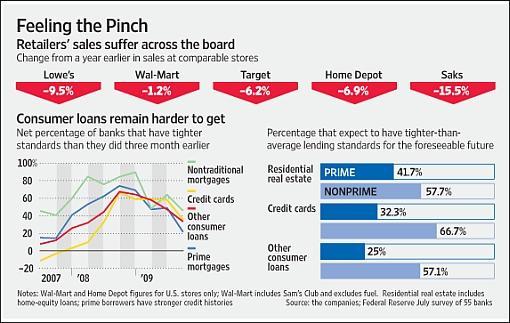
Bloomberg: Fed says banks tightened lending in second quarter “US banks tightened standards on all types of loans in the second quarter and said they expect to maintain strict criteria on lending until at least the second half of 2010, a Federal Reserve report showed today.
“Most banks cited reduced risk tolerance and ‘a more uncertain economic outlook’ as the main reasons for restricting credit to businesses, with 35.2% saying they ‘tightened somewhat’, the Fed said in its quarterly Senior Loan Officer survey.
“The report suggests that lenders and borrowers were wary of taking on more risk until the US economy showed clearer signs of recovering. Since the survey, economists have raised their outlook for growth as data suggested home sales and manufacturing were stabilizing, and the Fed said last week that the economy is ‘leveling out’.
“‘The report tells us that credit is not becoming more readily available, but also that the credit freeze is at least moving in the direction of a thaw,’ said Carl Riccadonna, senior economist at Deutsche Bank Securities.
“The survey of 55 US banks and 23 US branches of foreign banks found that demand for loans continued to weaken ‘across all major categories’ except prime residential mortgages, the central bank said.”
Source: Craig Torres, Bloomberg, August 17, 2009.
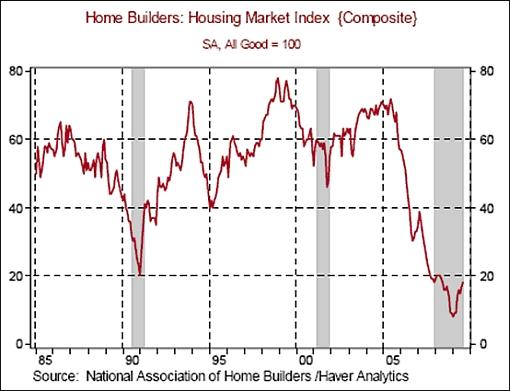
Asha Bangalore (Northern Trust): Housing Market Index shows noteworthy improvement “The Housing Market Index (HMI) of the National Association of Home Builders rose to 18 in August from 17 in the prior month. The level of the HMI is the highest since June of 2008. The cycle low for the index (8.0) was recorded in January 2009.
“The index measuring current sales of new single-family homes held steady at 16. But, the index measuring sales of home six months ahead rose to 30 in August from 26 in the prior month. The cycle low for this index was 15 in February 2009. The index tracking traffic of prospective buyers of new homes moved up to 16 in August from 13 in the prior month. The cycle low for this index was 7 in December 2008. The main conclusion from this report is that the market for new homes is recovering.”
Source: Asha Bangalore, Northern Trust - Daily Global Commentary, August 17, 2009.
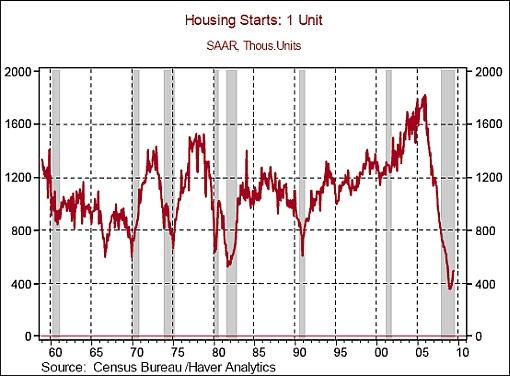
Asha Bangalore (Northern Trust): Home construction is recovering, albeit at a slow pace “Starts of new single-family homes increased 1.7% in July to an annual rate of 490,000, the fifth consecutive monthly gain. The cycle low was 357,000, the lowest on record for the data series which goes back to January 1959. Regionally, starts were strong in the Midwest (+12.9%) but fell in the Northeast (-16.3%), South (-1.4%) and West (-1.6%). Multi-family starts dropped 13.3% in July.
“On a year-to-year basis, starts of new single-family homes fell 20.4% in July, the smallest drop since April 2007.
“The level of housing starts and the year-to-year trend indicate that the construction of new homes has posted a bottom. A robust recovery is several months ahead.”
Source: Asha Bangalore, Northern Trust - Daily Global Commentary, August 18, 2009.
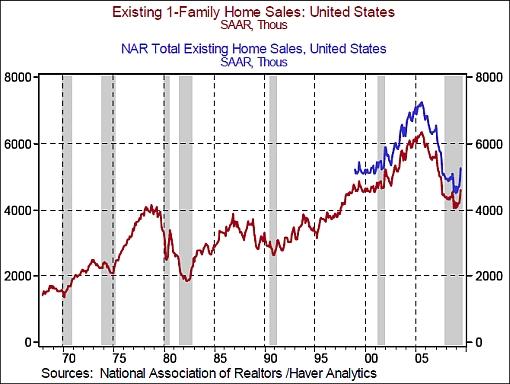
Asha Bangalore (Northern Trust): Sales of existing homes advance, inventories flat, and prices falling less rapidly “Sales of all existing homes rose 7.2% to an annual rate of 5.24 million units during July, marking the fourth consecutive monthly gain. Purchases of existing single-family homes increased 6.5% to an annual rate of 4.61 million units. Sales of existing single-family homes have now risen 13.8% from the record low of 4.05 million units in January 2009. The $8,000 tax credit is believed to have contributed to the increase sales of existing homes.
“The median price of an existing single-family home dropped 2.0% in July from the prior month to $178,300. The median sales price of an existing single-family home is down 14.7% from a year ago. This represents an improvement from the record 16.9% drop recorded in April of 2009.
“Seasonally adjusted inventories of existing single-family homes were virtually flat (8.24 months supply) compared with the situation in June (8.26 months supply). The peak of the inventories-sales ratio occurred in January 2009 (13.3 months). The median inventories-sales ratio is 7.2-month supply, which implies that the inventories sales ratio needs to make a significant breakthrough to match the historical median. In sum, the housing sector continues to present a fragile recovery, at the least.”
Source: Asha Bangalore, Northern Trust - Daily Global Commentary, August 21, 2009.
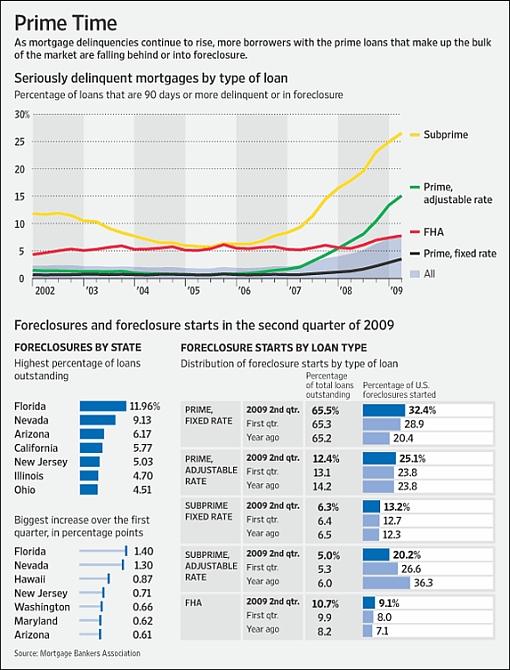
Financial Times: Mounting joblessness fuels US housing crisis “More than one in every eight homeowners with a mortgage was behind on home loan payments or in some stage of foreclosure at the end of the second quarter, as mounting unemployment aggravated the housing crisis, the Mortgage Bankers Association said on Thursday.
“The percentage of loans that were in foreclosure or at least one payment past due rose to 13.16%, the highest increase since the MBA began keeping records in 1972 and a jump of more than a percentage point since the first quarter.
“Jay Brinkmann, chief economist at the MBA, said signs were growing that mortgage performance is being affected more by unemployment than by the structure of risky home loans, indicating a new stage in the foreclosure crisis that may not be easily addressed by government loan modification programmes.
“While the proportion of foreclosures started on borrowers with subprime adjustable-rate mortgages fell dramatically in the second quarter, foreclosure starts on traditional prime fixed-rate loans saw a dramatic increase. Prime fixed-rate loans accounted for one in three foreclosure starts at the end of the second quarter. A year ago they accounted for one in five.
“‘There has been a shift in the problem from one driven by the types of loans to one driven by macro problems in the economy and drops in house prices,’ said Mr Brinkmann.
“Mr Brinkmann said “it is unlikely we will see meaningful reductions in the foreclosure and delinquency rates until the employment situation improves”. Mr Brinkmann expects the peak in foreclosures to lag the peak in unemployment by around 6 months.”
Source: Saskia Scholtes, Financial Times, August 20, 2009.
The Wall Street Journal: Souring prime loans compound mortgage woes
Source: Nick Timiraos, The Wall Street Journal, August 21, 2009.
Bloomberg: Commercial property values fall as rent drop forecast “Commercial real estate values in the US fell 27% in the year through June and rents for offices, shops and warehouse space may continue to drop through 2010 as the recession saps jobs and consumer spending.
“The Moody’s/REAL Commercial Property Price Indices fell 1% in June and are down 36% from their October 2007 peak, Moody’s Investors Service said in a report today. A rebound isn’t likely until the second half of next year, the National Association of Realtors forecast in a separate report.
“Unemployment of 9.4%, falling industrial production and a drop in consumer spending curbed property demand, NAR said. Falling rental income and scarce credit are hurting both landlords and investors in securities backed by commercial property loans.
“‘It’s too soon to call the bottom,’ said Connie Petruzziello, a Moody’s analyst and co-author of the commercial property price report.
“The 1% drop in Moody’s index is the smallest monthly decline since February, when it fell by 0.6%. The measure fell more than 7% in both April and May.”
Source: David Levitt and John Gittelsohn, Bloomberg, August 19, 2009.
The Wall Street Journal: Reluctant shoppers hold back recovery “Major retailers reported that American consumers are continuing to hunker down, casting a cloud over the durability of the US recovery and underscoring the importance of overseas demand in restoring the world economy to health.
“American consumers appear so shaken by the worst recession since the Great Depression - and so pinched by unemployment, stagnant wages and stingier lenders - that they are reining in spending on all but basics. Economists also see an upturn in US household saving as the beginning of a prolonged period of thrift.
“The retailers’ reports serve as a reminder that it will be consumers, foremost, who will fuel a sustained US recovery. Consumer spending accounts for about 70% of all demand in the US economy.
“Most economists expect growth to resume in the second half of this year at a modest pace, as US businesses rebuild depleted inventories and the housing market stabilizes. Economists who see a second-half rebound point to a global-manufacturing revival and recent reports that the economies of France, Germany and Japan managed to expand in the second quarter.
“But US consumers could be the counterweight. In a survey of economists this month, The Wall Street Journal asked if a substantial increase in consumer spending was needed for sustained growth. Of the 43 economists who responded, 60% said yes.”
Source: Ann Zimmerman and Sara Murray, The Wall Street Journal, August 19, 2009.
Yahoo Finance: Top “Cash for Clunkers” trade-ins and new cars “The Top Ten ‘Cash for Clunkers’ Trade-Ins:
1. 1998 Ford Explorer 2. 1997 Ford Explorer 3. 1996 Ford Explorer 4. 1999 Ford Explorer 5. Jeep Grand Cherokee 6. Jeep Cherokee 7. 1995 Ford Explorer 8. 1994 Ford Explorer 9. 1997 Ford Windstar 10. 1999 Dodge Caravan
“The Top Ten ‘Cash for Clunkers’ New Cars:
1. Ford Focus 2. Honda Civic 3. Toyota Corolla 4. Toyota Prius 5. Ford Escape 6. Toyota Camry 7. Dodge Caliber 8. Hyundai Elantra 9. Honda Fit 10. Chevy Cobalt”
Source: Sean Tucker, Yahoo Finance, August 19, 2009.
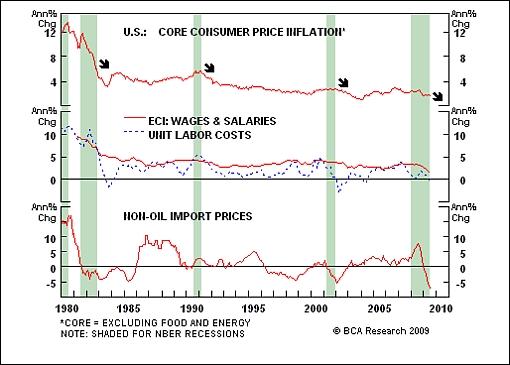
BCA Research: US core inflation finally breaking down “Disinflation and positive real GDP growth in the second half of the year should provide a positive macro backdrop for the equity market.
“The resilience of core CPI inflation to recessionary conditions appears to be gradually breaking down (core inflation fell to 1.5% in July). It has been somewhat disconcerting that core inflation has been sticky, although this has been partly due to special factors such as tobacco tax hikes. Nonetheless, the chart shows that in past cycles most of the decline in inflation occurs after the recession ends, as economic slack affects inflation with a significant lag. Thus, the cyclical disinflationary phase is likely just getting started.
“Moderating labor cost growth and falling import prices highlight that “cost-push” inflation pressure is low and still easing. Commodity prices have increased, but there is little chance of this being passed on into consumer prices given the yawning output gap.
“Lower core inflation will help to contain long-term inflation expectations and make it easier for the Fed to keep the long end of the Treasury curve from rising prematurely (i.e. before the economy can handle higher rates). Thus the macro backdrop should be positive for riskier asset classes such as equities in the coming quarters.”
Source: BCA Research, August 18, 2009.
Eoin Treacy (Fullermoney): Avoiding inflationary outcomes “All of the debt that has been built up over the last decade will eventually be paid down in one shape or form. Increasing the government’s portion of the total is helping to transfer some of the burden from the private sector. At the same time, quantitative easing is effectively diluting the value of the currency that debt is denominated in.
“Householders are relying on the success of these policies to reignite economic growth and in so doing, help them pay down their debt. Higher savings, lower expenditure, more taxes, smaller government and an absence of foreign wars would all help ease the burden of debt but are unlikely to provide the kind of stimulus that would see GDP back up in the pre-crisis 3% range.
“Faced with the unpalatable options of raising taxes and cutting expenditure or inflating the problem away, politicians have always favoured incorporating the latter in their solutions. Monetary authorities will continue to attempt to adjust the amount of liquidity to compliment the Velocity of Money regardless of other solutions.
“M2 surged in the last couple of years as the Velocity of Money plunged, ensuring the market remained liquid. However, Velocity of M2 edged upwards in June for the first time in a year. Consequently M2 expansion paused, ensuring that the multiple retains its trajectory. The advance in the Velocity of M2 is not yet enough to suggest recovery, further improvement is necessary to suggest such an outcome. (One should bear in mind that this is a lagging indicator by definition.) However, as long as these measures continue to be managed so that the multiple does not accelerate, inflationary fears are likely to be under control. However, a number of factors could upset this balancing act.
“Potential issues will arise when the economy begins to recover because by definition, Velocity of Money will begin to advance. Money Supply would have to tighten in this scenario if inflation is be kept under control but the debt burden will still be high and consequently consumer confidence will be fragile. Arguments for retaining the stimulus in this environment will be formidable but would serve to stoke inflationary pressures over the medium term.
“Surging commodity prices, as we saw last year, are another potential obstacle. A secular bull market in commodity prices, driven by a rising cost of production and increasing global per capita consumption is likely to produce periods when inflationary pressures become more problematic. The normal monetary response would be to raise rates and reduce Money Supply. However, this may be highly controversial if economic growth remains weak, as is likely to be the case in the medium term.
“Another potential impediment would be if the US dollar were to come under sustained selling pressure. This could be in response to domestic factors but is just as likely to reflect the relative performance of the US economy with that of its largest trading partners. Right now, most of the world’s major economies are struggling to return to growth but those with less of a problem with excess leverage and debt are at a competitive advantage. Just how big this is will become evident over the coming years and the dollar could be a medium-term victim. Of course, in such a scenario, a sharply weaker currency would eventually help to support manufacturing and restore the USA’s lost competitiveness.
“In the short-term, inflation in the broad sense is not a problem. Deflationary pressures predominate in wages, housing and retail. Inflationary pressures remain in public services and potentially in commodity prices. The opportunity remains to put policies in place that help to avoid an inflationary outcome to the credit crisis but one can be justified in questioning if the political will exists to implement what will surely by unpopular decisions.”
Source: Eoin Treacy, Fullermoney, August 19, 2009.
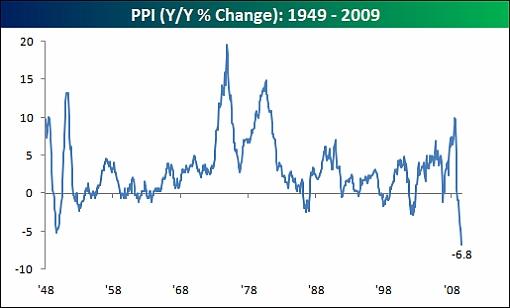
Bespoke: Record low PPI “In a reminder that the current economic situation is far from normal, today’s [Tuesday] year/year change in the PPI (producer price index) came in at a record low of negative 6.8%. This is the lowest reading for the PPI going back to 1949, easily eclipsing the prior record low of -5.2% in August 1949.”
Source: Bespoke, August 18, 2009.
Bloomberg: Scholes, Merton says banks should value assets better “Myron Scholes and Robert Merton shared the 1997 Nobel price for economics, and they are now united in calling for banks to give more accurate valuations on their illiquid assets.
“Financial institutions should use mark-to-market accounting or list the hard-to-value securities on public exchanges whenever possible, Scholes said in a Bloomberg Radio interview yesterday. Scholes, winner of the Nobel with Merton for helping invent a model for pricing options, said investors need better data on prices to accurately value the debt and equity securities of banks.
“‘I’d like to see us encourage many more securities held on the books of the banks be migrated to exchanges if possible,’ he said. Doing so would ‘allow for market discovery and market pricing as much as possible,’ Scholes added.
“Banks that oppose new accounting standards on asset values want to conceal depressed prices, Merton wrote in the Financial Times yesterday. He composed the column with Robert Kaplan, a professor at the Harvard Business School along with Merton, and Scott Richard, a professor at the University of Pennsylvania’s Wharton School.
“‘This is not the way forward,’ they wrote. ‘While regulators and legislators are keen to find simple solutions to complex problems, allowing financial institutions to ignore market transactions is a bad idea.’”
Source: Jeff Kearns, Bloomberg, August 19, 2009.
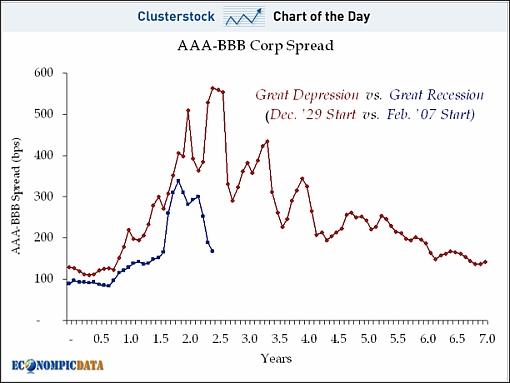
Clusterstock: Credit may crunch again before getting back to normal “It would be very unusual if we emerged from a credit crisis with a simple V-shaped recovery. (Or A-shaped if we think in terms of credit spreads)
“Going back to the Great Depression, we experienced a few sucker’s rallies before credit markets ultimately normalized. As this chart from Econompic Data shows, while credit spreads have recovered from their recent spike, they may still get worse before getting better.”
Source: Vincent Fernando, Clusterstock - Business Insider, August 19, 2009.
Financial Times: Bond issuance bursts through $1,000 billion “Global corporate bond issuance has risen above the $1,000 billion mark - the first time it has broken through this threshold in a single year - with four months remaining of 2009.
“The boom is because of the difficulty companies face in obtaining bank loans and strong demand from investors, who can gain a big yield pick-up on corporate paper compared with government bonds.
“Investors have switched more of their cash into corporate bonds because they offer better returns than the low interest rates on bank deposits and savings accounts.
“Corporate bond issuance has risen to $1,103 billion so far this year, beating the annual record of $898 billion in 2007, according to Dealogic, the data provider.
“The jump in issuance has been seen in dollar, euro, yen and sterling-denominated deals.
“Volumes in dollar, euro and sterling have risen to record annual highs, only eight months into the year, while volumes in yen are close to record levels.
“Of the $1,103 billion raised this year, $989 billion, or 90%, has been in investment-grade bonds, with 30% issued by companies in the utilities and oil and gas sectors.”
Source: David Oakley and Ed Hammond, Financial Times, August 18, 2009.
© 2005-2022 http://www.MarketOracle.co.uk - The Market Oracle is a FREE Daily Financial Markets Analysis & Forecasting online publication.


