Gold, Silver and U.S. Dollar Head and Shoulder Technical Patterns
Commodities / Commodities Trading Aug 20, 2009 - 02:36 AM GMTBy: Chris_Vermeulen
 Everyone is talking about gold shooting to the moon because of the massive reverse head & shoulders pattern forming, not to mention the economy isn’t as good as some of us would like it to be. I put together this quick report to show the bearish side of things for once.
Bearish Points for Gold & Silver:
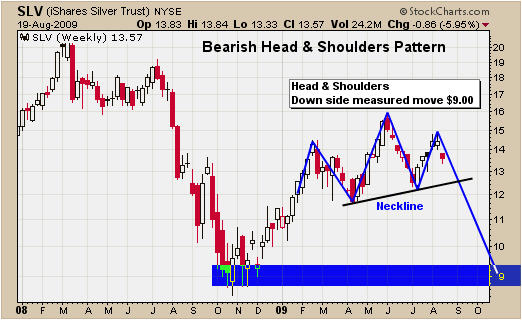
• Silver looks to be forming a H&S pattern
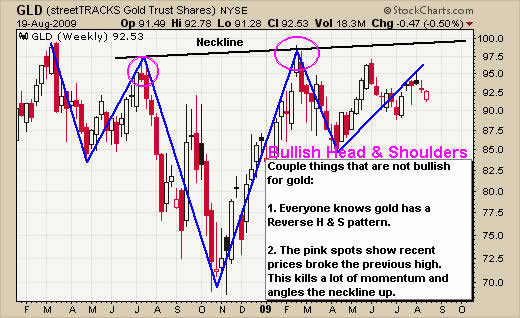
• Gold made a new high in March and quickly sold off
• Gold’s neckline is angled up which makes for a weaker breakout if it occurs
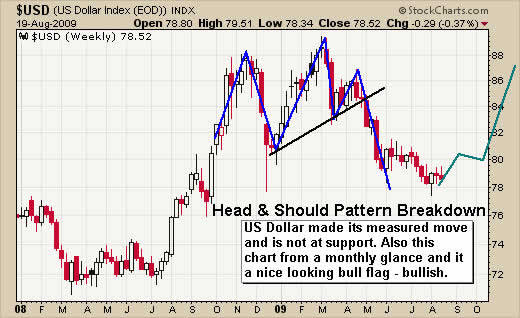
• The US Dollar looks ready for big rally.
SLV ETF – Weekly Chart
Silver is a great performer but we may have to start looking at shorting precious metals in the coming months if prices start breaking down.

GLD ETF – Weekly Chart
I like to be bullish on precious metals but these charts don’t provide much comfort. I will admit there are bunch of different ways to draw this gold chart which can make it look very bullish. But we cannot forget that the market will hurt the most individuals possible and we must be ready for these moves when they happen. Most traders think gold is going to breakout to the up side because of the economy and the famous Gold Reverse H&S pattern. But if everyone thinks this already wouldn’t everyone already be in gold? Who is going to buy gold to take it to the next level??
Also I want to point out that this reverse H&S has a neckline angled up which in my opinion is not a good sign. It shows the price was allowed to move above the previous pink high to suck in traders/investors as they panic to buy the breakout. Soon after buying gold they get taken to the cleaners as price plummeted. I just know from day trading that this type of head & shoulders pattern is not as accurate to trade and I avoid them (price patterns perform the same in all time frames).

US Dollar – Weekly Chart
Take a quick look at the US dollar. It formed a very nice H&S pattern and broke down to the measured move area quickly. Also this chart looks like a large bull flag and could start to move higher from this support level in the coming months. If this happens we will see precious metal prices drop.

Technical Trader Conclusion:
The precious metals market is under pressure from the US dollar and some major resistance levels. Overall silver is underperforming gold and I look at silver as leading indicator. We are currently in cash waiting for a low risk setup for gold, silver, oil and natural gas.
Hello, I'm Chris Vermeulen founder of TheGoldAndOilGuy and NOW is YOUR Opportunity to start trading GOLD, SILVER & OIL for BIG PROFITS. Let me help you get started.
If you would like more information on my trading model or to receive my Free Weekly Trading Reports - Click Here
If you have any questions please feel free to send me an email. My passion is to help others and for us all to make money together with little down side risk.
To Your Financial Success,
By Chris Vermeulen
Chris@TheGoldAndOilGuy.com
Please visit my website for more information. http://www.TheGoldAndOilGuy.com
Chris Vermeulen is Founder of the popular trading site TheGoldAndOilGuy.com. There he shares his highly successful, low-risk trading method. For 6 years Chris has been a leader in teaching others to skillfully trade in gold, oil, and silver in both bull and bear markets. Subscribers to his service depend on Chris' uniquely consistent investment opportunities that carry exceptionally low risk and high return.
This article is intended solely for information purposes. The opinions are those of the author only. Please conduct further research and consult your financial advisor before making any investment/trading decision. No responsibility can be accepted for losses that may result as a consequence of trading on the basis of this analysis.
Chris Vermeulen Archive |
© 2005-2022 http://www.MarketOracle.co.uk - The Market Oracle is a FREE Daily Financial Markets Analysis & Forecasting online publication.


