


The Most Important Aspect that most Economists and Analysts Fail to Recognize
Commodities / Energy Resources Aug 20, 2009 - 02:18 AM GMTBy: Steve_St_Angelo

 EROI…Energy Returned on Energy Invested
The biggest problem that most economists and analysts fail to comprehend when making forecasts and predictions on the US Dollar, Precious Metals, Financials or the whole Economy in general, is the ability to get to the Root of the Problem. Most of them are using information and methodologies that are either outdated, superficial or completely worthless. Those economists who are either Keynesians or Monetarists are living in a economic model that will have a life expectancy of less than a century. Indeed, a blip in the history of mankind and increasingly worthless going forward into the 21st century.
Unfortunately, the leaders in government and finance who are making the grand decisions are still well entrenched in this worthless monetarist’s economic model. We know their forecasts are worthless, as all you have to do is to remember that at the end of 2007 and beginning of 2008 the head of the U.S. Treasury, Hank Paulson, Fed Chairman Ben Bernanke, and President George Bush were saying, “The Fundamentals of the Economy were Sound.” All it took was a little patience and bubble gravity to make their words complete rubbish.
As we head down the hierarchy of economists and analysts, we find even more stupidity. One example is the infamous YouTube video on August 18, 2007 when Peter Schiff debated Ben Stein and Charles Payne on Fox Business News. Link to YouTube video here: HERE. Ben Stein, who you can still see plastered on Yahoo Finance’s front page as an EXPERT OPINION, made the most lousy forecast by saying, “Merrill Lynch was so cheap, they should have put them in Cereal boxes.” Peter Schiff, on the other hand, had said financials were terrible investments. At the time, Merrill Lynch’s stock price was $76.04 a share. One year later in August of 2008, it had fallen to $25 a share. If that wasn’t bad enough, Merrill fell to $11.27 by the end of 2008. Ben Stein’s expert opinion made mince meat out of the investing public’s buy and hold portfolio. It is amazing to me that those with a decent functioning brain stem still listen to anything any of these people have to say.
The list goes on and on when you include most of the analysts on CNBC, FOX Business, and Bloomberg who are calling for a bottom in the housing market, end of the so called recession, return of green shoots, higher stock prices and continued safety in the U.S. Treasury markets. Unfortunately, nothing could be further from the truth. Why? You can blame that on (EROI) Energy Returned on Energy Invested.
(EROI) Energy Returned on Energy Invested
EROI, or sometimes known as EROEI, is what I term as “The Root of the Problem.” Before I get into why most economists and analysts are missing the boat in their present and future forecasting, I have to lay a basic foundation of EROI - Energy runs this modern economy of ours. Without cheap and abundant oil our global economy would come crashing down. We are able to have this modern lifestyle due to the surplus of energy we get from the energy invested. Basically, EROI is how much net energy remains after production. Cutler Cleveland of Boston University has reported that the EROI of oil and gas extraction in the United States has declined from 100:1 in 1930 to 30:1 in 1970, down to 11:1 in 2000.[1]
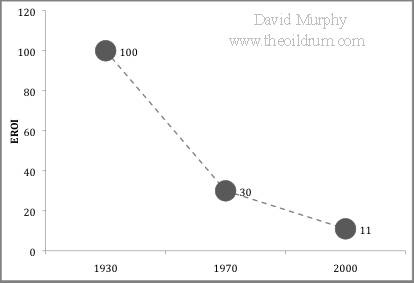
Plot of three estimations of EROI for U.S. oil and gas: (Source)
What this means is that during the 1930’s the oil men in Texas, Oklahoma and Louisiana were finding so much oil, it only took the amount of energy in 1 barrel of oil to produce 100 barrels for the market. It was this great oil endowment that allowed the United States to build the largest economy and infrastructure in the world. The implications of the declining EROI from the chart above reveals that in the future the United States will have to invest more energy to get less in return.
Furthermore, declining EROI means that the net energy which is contained in each unit of energy (oil, gas, etc) delivered to the market will decrease over time requiring even larger amounts of energy just to meet demand. This will decrease the amount of energy in the ground and will make it even more difficult to extract the remaining energy.
 If you look at the ratios you will realize that men gathering and harvesting food in the good ole days were much more productive than the modern farmer sitting in his air conditioned quarter million dollar John Deere tractor today. For instance, a typical pre-industrial farmer with a horse and plow could produce 10 units of energy (food) by only expanding 1 unit of energy (work). The modern agricultural practices of the past 50-70 years have been possible only with high EROI. The present system of food production and distribution is devouring 16 times the energy to supply only 1 unit of energy in the form of food.
Many people believe that technology will solve our future problems, but as you can see from the ratios above, technology has done just the opposite. The modern food production and distribution system has been a huge net drain on our vital resources. If technology was used correctly in the benefit of mankind, it would have been utilized to increase the EROI not decrease it. This wasn’t much of a problem with cheap and abundant energy, but now that the world is peaking in global oil production higher prices and volatility are here to stay.
Peak Oil and EROI
There has been great debate about the timing of the Global Oil Peak. Many believe we have reached peak oil already. Here is a modern graph of M. King Hubbert’s World Peak Oil Graph, which he presented in 1956.
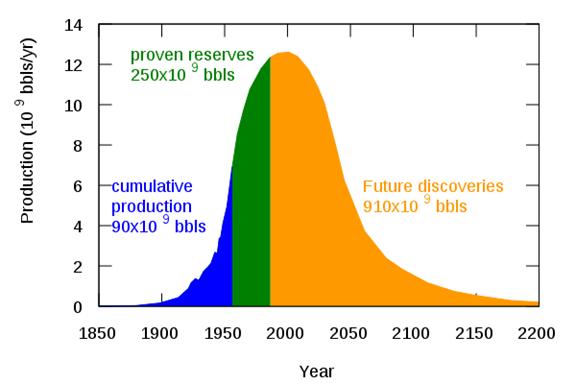
(Source: Wikipedia)
If it is true, that the world is peaking in oil production, it has serious ramifications for the Global Economy. The only way an economy can grow is by growing its energy source. Any economist will tell you the best way for any country to pay back its debts and the interest on those debts is in a growing economy. Thus, a declining energy supply will contract the Global Economy. The decline of oil production as Hubbert predicted is not as simple as his uniform bell curve represents. It would be nice to rely upon all that oil on the downward slope of the graph; unfortunately, EROI will produce a much different picture.
If we would take Cutler Cleveland’s EROI figures of 100:1 to 30:1 to 11:1 and plug them into the United States Peak Oil Graph, this is what it would look like:
United States Gross & Net Oil Production Estimates
(in thousands of barrels)
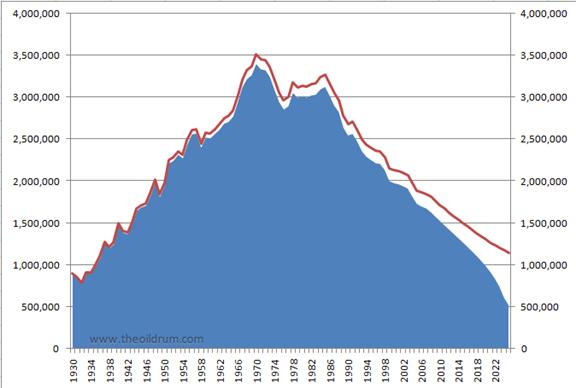
Red is Gross Production, Blue is Net
(Source: Nate Hagens-theoildrum.com)
As you can see from the graph above, by 2010 the gross oil production will be about 1.7 billion barrels a year with a 1.5 billion net. Thus, the net supply is still a large percentage of overall production. However, by 2025 the net oil supplied to the United States will have fallen by more than half due to the decreasing EROI. The Red line shows that in 2025 the USA will produce about 1.2 billion barrels of oil, but it will only be able to supply about 500 million barrels net (discretionary) to the market. Where did that 700 million barrels go? The 700 million barrels went into the increasingly higher amount of exploration, development and production costs. Even though these are estimations, at some point in the near future, we will past the BREAK-EVEN POINT. In that, it will take more energy to extract the oil then you get from using it.
Global EROI and Forecasts
If we look at what is going on in the global oil scene it’s not much better. Nathan Gagnon, Charles Hall, and Lysle Brinker recently presented a paper to the Energies journal called “The Preliminary Investigation of Energy Return on Energy Investment for Global Oil and Gas Production.” They estimate that the EROI at the wellhead was roughly 26:1 in 1992, increased to 35:1 in 1999, then decreased to 18:1 in 2006.[2] The reason why the EROI went up to the 35:1 ratio in 1999 was partially due to the low price of oil, especially when it dropped to $10 a barrel. The lower the price of oil the higher the EROI ratio and vice-versa. I can only imagine what the global EROI was when oil hit $140’s in 2008.
When they say that the EROI is 18:1 at the wellhead, this is the energy returned on energy invested the moment the oil comes out of the well. If we were to include the energy it takes to refine the oil, transport through pipelines, and then finally truck the gasoline/diesel to individual filling stations this decreases the EROI even further. And, we haven’t even considered the cost of energy on maintaining the infrastructure. What’s the use of having gasoline or diesel if you don’t have good roads and bridges to drive on? When you start to add all these additional energy costs to the EROI equation you find that as times goes by there is less and less net energy left for the economy in general.
Here is a graph of Global EROI from 1992 to 2006:
EROI for Global Oil and Gas production
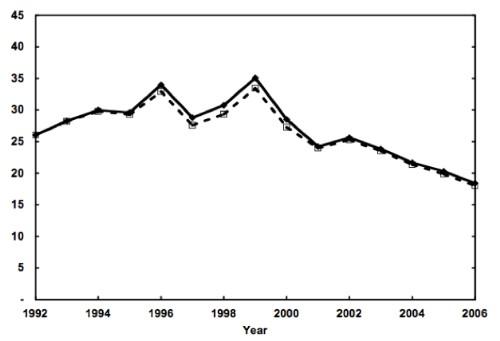
(Source:reprinted by David Murphy-theoildrum.com)
The authors of the paper, previously cited, used 3 data inputs from the EIA (Energy Information Agency), the British version of the EIA, and John S. Herold Inc., the worlds leading independent researching firm on energy valuation and measurement, to get their EROI figures. Even though there has been some volatility in the figures, the overall EROI ratio has declined from 26:1 in 1992 to 18:1 in 2006.
Furthermore, to get a best estimate of future EROI, they took a linear extrapolation of the trend and forecasted it between the steepest and more gradual trends. According to the paper:
![Text Box: Our results indicate that indirect energy use (the energy cost of materials and supplies) represents 11% of total energy input in 1992 and 9% in 2006, with an average of approximately 11% over the entire study period. If the EROI for global oil and gas extraction continues to follow the trend that is has over the period of this analysis, andif a linear extrapolation of that trend is appropriate, then the EROI would drop to 1:1 in about three decades. [2]](/images/2009/Aug/eroi_image010.gif)
Linear Extrapolations of Historic EROI Trends
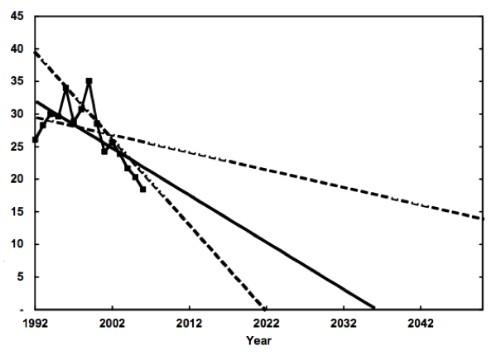
(Source: reprinted by David Murphy-theoildrum.com)
The black solid line represents the trend line of past global EROI plotted into the future. Both black dashed lines represent a steeper and more gradual trend. As you can see, the global EROI oil and gas production figures from 1992 to 2006 have been superimposed on the chart to give an estimation of hitting an EROI of 1:1 by approximately 2036. This is about a decade and a half after the United States will supposedly reach its EROI of 1:1.
What’s the Big Deal about an EROI of 1:1?
Well, that’s the real clincher. The United States and most of the western world has been built on cheap and abundant oil with a high EROI. When we were extracting oil at 100:1 down to 30:1 there was plenty of net oil left to supply the growing economy. Now that the United States EROI is only a fraction of its once formal self, there is far less discretionary oil available to the economy…hence the rise of the price of a barrel of oil to $140.
An EROI of 1:1 means that there is no net oil remaining after exploration, development and production is considered. It becomes a zero-sum game. That isn’t the worst of it. Once you figure in all the other energy costs of refining, transportation and maintenance of the infrastructure system for a modern economy to be a sustainable one there has to be a minimum EROI of 3:1. If you want to bore yourself with the details of why a 3:1 is a minimum EROI for a modern society to survive, you can read “What is the Minimum EROI that a Sustainable Society Must Have?” [3]
Has the light gone off in your head yet? Once the USA and the world hit an EROI of 1:1 -- it’s game over. We have passed a sustainable 3:1 ratio for a modern economy. This has serious consequences to many facets of our society. This is what most economists and analysts are missing in their forecasts. They are getting in front of television cameras and writing online articles, predicting where the economy is heading without understanding the most fundamental aspect… the EROI. They are in fact just rambling on without a clue. I call it “BLABBERING IN A VACUUM”.
Conclusion
In my opinion, EROI will prove to be one of the most important aspects in understanding where we are headed in this global economy. As the EROI ratio declines in the future it will put a severe strain on mining, manufacturing and production in the world. EROI will affect precious metals, industrial metals, agriculture, real estate, the US Dollar, all fiat currencies, stocks, bonds and just about everything else one could imagine.
Economists and analysts talking about green shoots, a bottom in the recession, and a return to the good old days are totally incompetent. The continued blabbering never ceases to amaze me. The huge debts attached to the public and private sector in the United States will never be paid back; they are nothing more than a huge Ponzi scheme. Printing US Dollars might allow the grand economic iIlusion to continue for a brief period longer, but the ultimate extinguisher of debt won’t be gold, as Mr. Antal Fekete reminds us, but rather the lowering of the EROI ratio.
Don’t get me wrong, I am very bullish on Gold and Silver. The lowering of the EROI ratio makes precious metals even more bullish far into the future. Once the world figures out that in a declining EROI environment debts will be increasingly difficult, if not impossible, to be paid back; the entire US Debt Market will implode. There will be a great avalanche of investors stampeding out of Ponzi debt (i.e. US Treasuries, US Bonds and US Dollars), and into tangibles -- especially Gold and Silver.
In future articles, I plan on writing how the EROI will affect different individual markets. My next article will focus on EROI and its affect on the mining industry, especially with regard to silver in a response to Bob Moriarty’s recent article, “Mexican Silver”. Mr. Moriarty says silver won’t hit $100 an ounce unless we go back to a gold standard. He states that Mexico has so much silver, the country has barely been scratched. Although I am on the same side as Mr. Moriarty when it comes to gold and silver, he fails to understand what EROI will do to future silver production. Even though there may be a lot of silver down in them thar hills, you need energy to get it out.
Energy which is actually Net Energy, becomes increasingly more expensive and less available in a falling EROI environment.
Reference
[1] Net energy from extraction of oil and gas in the United States, by Cutler J. Cleveland, Energy, Volume 30, Issue 5, April 2005, Pages 769-782
[2] A Preliminary Investigation of Energy Returned on Energy Investment for Global Oil and Gas Production, by Nathan Gagnon, Charles A.S. Hall, and Lysle Brinker, Energies 2009, 2, Pages 490-503
[3] What is the Minimum EROI that a Sustainable Society Must Have?, by Charles A.S. Hall, Stephen Balogh, and David J. R. Murphy, Energies 2009, 2(1), Pages 25-47
Steve St .Angelo
Independent researcher
residing in southwest Utah
Contact sst.angelo@gmail.com
© 2009 Copyright Steve St .Angelo - All Rights Reserved
Disclaimer: The above is a matter of opinion provided for general information purposes only and is not intended as investment advice. Information and analysis above are derived from sources and utilising methods believed to be reliable, but we cannot accept responsibility for any losses you may incur as a result of this analysis. Individuals should consult with their personal financial advisors.
© 2005-2022 http://www.MarketOracle.co.uk - The Market Oracle is a FREE Daily Financial Markets Analysis & Forecasting online publication.