


Stock and Financial Markets Walking a Dangerous Inflation/ Deflation Tightrope
Stock-Markets / Financial Markets 2009 Aug 19, 2009 - 07:48 AM GMTBy: Joseph_Russo

 Timing, Perspective... When it comes to engaging financial markets, timing is everything. When and where does one enter or exit, what are his or her objectives, and what frame of reference does one use to make such decisions. Answers to the above are essential prior to committing speculative funds against any given timeframe or set of objectives one may consider.
The most important aspect to answering these questions is to clearly identify one’s timing objectives, and then adhere to best practice disciplines to carry out those objectives. In doing so, it is essential that one ignore all ancillary noise, which may or may not conflict with the objectives disciplinary protocols in use.
In developing strategies from which to engage, there are many perspectives and tactics one may adopt. Timeframes can swing from secular trends lasting decades to sell-offs and price-spikes lasting only an hour or two. In the middle reside cyclical trends that can last for years followed by intermediate, near-term, and shorter-term trends, which populate the balance of the time horizon landscape.
... the Majors and where key battle lines are drawn
No doubt, the 40% - 50% rise in equities from the March lows have turned the majority of participants bullish over the near-term. What does this bullish price action tell us about the balance of time-horizon perspectives? Well for one, the short-term trends have been bullish since March, and so have the near-term trends. Given the V-spike run-up, the intermediate-term trend looks promising but must still prove itself, while the cyclical and secular trends remain severely clouded.
 $USD Dollar Index
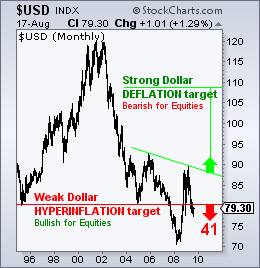
Since so many assets are valued in $USD, we view this index as the mother of all majors. Given the $USD has lost approximately 95% of its purchasing power at its lows in 2008, we can calculate that at its peak, this index (if it existed at inception) would have scaled the 1500 level at par value with a single dollar. Today, it remains in serious trouble below the 80-level, with a hyperinflationary downside price target of 41, which is another 50% haircut from current levels. Since inception and as historically proven with all other fiat currencies, the $USD was born at full value into a preordained secular bear market leading to its inevitable collapse and ultimate replacement. This current world reserve currency unit is the benchmark from which most assets are valued, trade deals negotiated and future business plans considered. It has become increasingly obvious that most major market values react (inversely) to changes in the value of this waning reserve currency, meaning that further devalued dollars will raise the underlying value of whatever types of assets that are priced in such units of measure. In kind, a stronger currency unit will reveal the true weakness in such asset values, or at least adjust their true values against their worth in stronger “dollars”. Currency devaluation (inflation) is one of the most egregious and illusionary taxes a government or central bank can impose upon its people.
 DOW JONES INDUSTRIALS
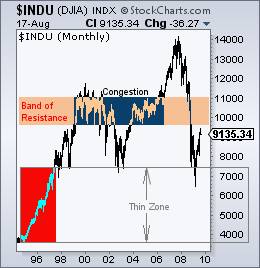
The long-term secular uptrend in the DOW has fractured severely. From this perspective, the cyclical trend remains down, as does the intermediate trend. The near-term and shorter-term trends are up but meaningfully extended. Just above current levels, resides seven years worth of price congestion resistance. The area below the key 7500 support level contains a very thin 3000-pt range lacking any record of congestive support above the 4000 level. Whereas the 80-level marks a tightrope for the $USD, the 7500 level marks a critical battle line for the Dow.
 GOLD
GOLD
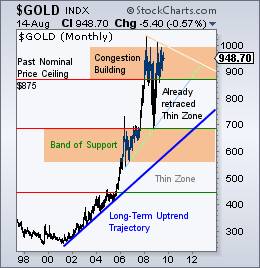
From the previous inflationary highs of 875 printed back in the late 1970’s, Gold continues to insist upon establishing a trading floor above those previously recorded highs some 30-years ago. Upon its first endeavor north of 875 and beyond 1000, it fell back hard through a thin zone of no support until it reached the 700-handle. Testing the upper end of this congestive band of support near 700, Gold retraced the 200-pt thin zone and has held steady above its former price ceiling of 875, which is precisely where we place the first battle line for Gold.
 NASDAQ 100
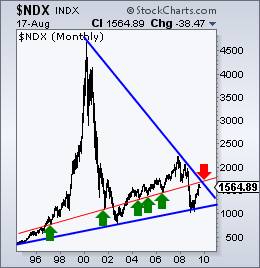
If one considers the 14-year gentle rising trendline from the 500 level in 1995 to the 1200 level in 2009 as part of an ongoing secular bull market, we suppose they would be technically correct. More pronounced is the 10—year downtrend connecting the 1999 and 2007 highs.
There is no doubt that something went severely wrong given the 80% crash following the aftermath of the tech bubble high in 1999. Bottom line is the secular trend remains seriously fractured. The 5-yr cyclical bull from 2002-2007 has also been seriously breached. We have illustrated three battle lines drawn for the NDX. The two thick blue lines create upper and lower converging trendline boundaries to a large pennant pattern. These two long-term boundaries identify an ever narrowing (and soon to vanish) margin of support and resistance. We view the tightrope for the NDX along the third rising internal trendline trajectory drawn in red. Post 1998, this line has only been breached twice, once amid the bear of 2002, and recently amid the bear of 2008. We note with green arrows how the NDX has bounced off this tightrope of support on five different occasions. At present, it remains in bearish mode beneath it despite its rapid attempt to back-test and reclaim trade above it. Remember, timing and relative perspective are everything.
For those who wish to obtain a visually graphic, easy to understand actionable guide to the various disciplines and real-time actions needed to achieve a broad array of objectives at every level of market engagement, look no further than Elliott Wave Technology’s PLATINUM publication. Those with only a short-term, near-term, or intermediate-term focus may select from the below list of PLATINUM’S three subsidiary sister publications.
 Trade the Supercycle IV -Wave
To safely speculate on, and effectively trade the endless array of unfolding subdivisions forthcoming in SC-IV, one may subscribe to any of our premium advisory services.
The express focus of Elliott Wave Technology’s Near Term Outlook is to provide equity index traders with actionable guidance over the near and medium term.
Position Traders Perspective provides actionable guidance for the long haul, while our Day Traders Perspective assists short-term traders in executing proprietary methodology for capturing price moves of short duration.
Elliott Wave Technology’s PLATINUM 500 CHALLENGE:
In our effort to serve and empower as many individuals to trade profitably amid the sharks on the street, we will soon be announcing the availability of $500 PLATINUM service coupons. We shall award these incredibly generous service coupons to select individuals who apply and qualify for entry. We will let those interested know when entry applications for the challenge become available, and shall announce further details of the PLATINUM 500 CHALLENGE as they develop, so stay tuned. If you are interested in pre-qualifying, send us an email containing “PLATINUM 500 CHALLENGE” somewhere in the subject line or body of the email. We will place your email address on our secure list of PLATINUM-500 applicants, and keep you apprised of further developments and qualification criteria.
Until then,
Trade Better / Invest Smarter...
By Joseph Russo
Chief Editor and Technical Analyst
Elliott Wave Technology
Email Author
Copyright © 2009 Elliott Wave Technology. All Rights Reserved.
Joseph Russo, presently the Publisher and Chief Market analyst for Elliott Wave Technology, has been studying Elliott Wave Theory, and the Technical Analysis of Financial Markets since 1991 and currently maintains active member status in the "Market Technicians Association." Joe continues to expand his body of knowledge through the MTA's accredited CMT program.
Joseph Russo Archive |
© 2005-2022 http://www.MarketOracle.co.uk - The Market Oracle is a FREE Daily Financial Markets Analysis & Forecasting online publication.