Seasonal Demands Analysis for Gold, Crude Oil and Copper
Commodities / Commodities Trading Aug 19, 2009 - 12:32 AM GMTBy: John_Winston
 Over the past 5 months the markets that crashed have staged a significant comeback. While the stock market usually grabs the headlines, there have been some great commodity runs as well.
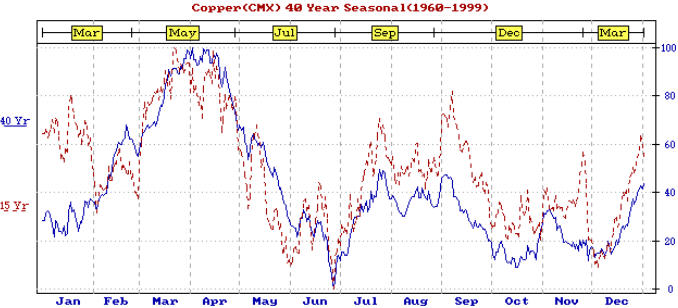
As the season’s change, the demands for commodities vary according to each respective market. For instance, let’s take a look at copper. Below is the 15 (Red) and 40 (blue) year averages of the Copper seasonal price chart. One of the more prolonged downtrends on the chart shows that from September to the middle of October, copper is usually weak. We can see the demand PHASE of this commodity is the December to April time frame.
(NOTE – Do not follow the yellow months. Those are Futures Contracts. Follow the blue months at bottom of chart.
Now let’s look at how copper has performed in relation to this chart. Shown below, the price chart of copper shows that a rally formed from December thru April right on time. In fact we can see how April’s high was in a very tight range, bouncing off the $4 dollar area each and every week in April. Interestingly, look at the seasonal chart. Notice how it also has a tight range for most of April. Sometimes price plays out exactly as it should, and other times, it’s a bit harder to see. Although there was a spike high in May, on a closing basis April provided the high and the correction lasted until the beginning of June before rallying to July. So far so good and a very accurate price comparison was in play. And then the meltdown of 2008 began.
Just like every other commodity and financial instrument, the price of copper collapsed. Instead of moving sideways over the summer and providing a September peak, copper began drifting lower into August. But the rally into September never appeared. If you look on the chart you can see August wend sideways and as soon as September arrived, the market drifted lower fighting to stay above $3 dollars. With the seasonal kicking in at around the same time, copper never stood a chance. The bearish factors overwhelmed the metal and the price retreated to $1.25 by years end.
COPPER SPOT WEEKLY CHART
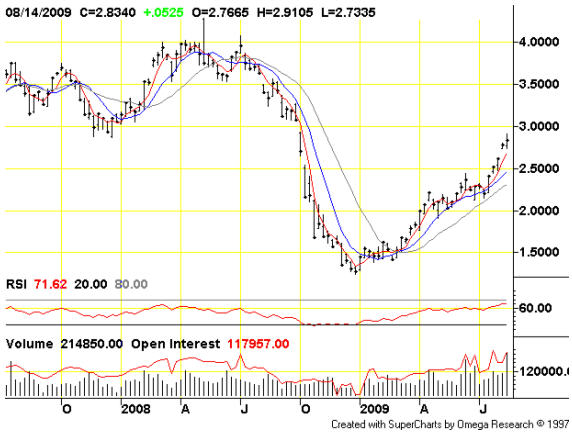
Now by this time, the UP portion of the seasonal came into effect. We can see that the December to April time frame of copper strength played out as we rallied right into April and we rallied strong. Here again the pullback was only 5 weeks and price began moving up again. In retrospect, a May high was indicative of strength as price rallied. Finally the June pullback came into effect and prices retreated to a June low. So rather than correct down from May to June, copper was so strong that it’s retreat only started in June and then corrected to the seasonal low into July. Again, this was a sign that copper was still very strong.
What next?
Copper is arriving at the point of the year in which weakness usually sets in. If we look at the seasonal chart it indicates that on average, copper peaks around the first week of September and barring a few short cover rallies, usually bottoms in December. This ebb and tide has been transpiring on average for the last 40 years so it is good to keep in mind. It is not a guarantee that price will correct. As a matter of fact, when a seasonal inversion happens, the moves are usually violent. But inversions are the exception, not the rule. The rule is that copper usually peaks in price near this time of year. For those who have played this run, it might be a good time to prune a little.
So where and what should we be looking for?
COPPER SPOT WEEKLY CHART
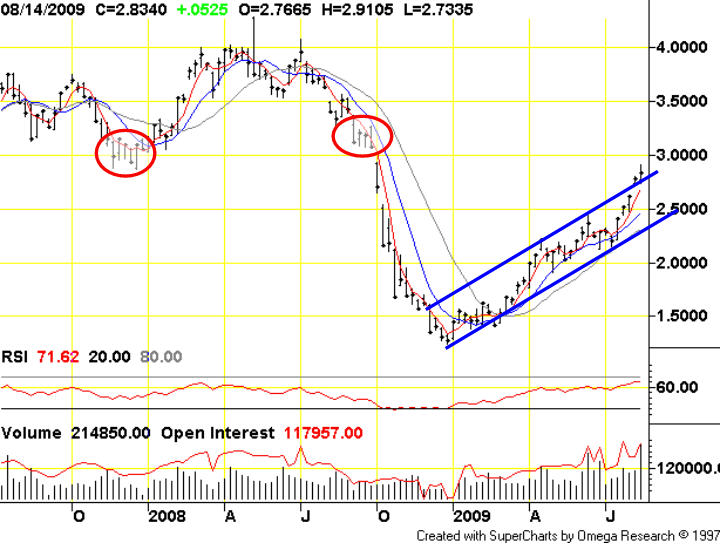
I’ve highlighted two areas on the chart by circling them with a red oval. Notice how this is the 2.95 – 3.30 ish area. Now let’s move over and look at price. We can see that price is just arriving at the $3 dollar area. By looking at the action circled, we should surmise that this is a very important area on the price chart. And look at copper jumping up and over its trend channel and arriving at this resistance area just when the seasonal highs are due to take place. Therefore, over the next four weeks, copper should provide us with a peak in price and a pullback into December. It certainly has been powered in some part by the China factor. In fact, the Canadian Dollar really took in on the chin earlier this week on concern with the Shanghai Index as it took a 17% haircut recently. If we keep in mind that this market has doubled since March we see that the pullback although steep, is still within the confines of a rising market. Nevertheless it was enough to rattle the Canadian dollar, which is a great “currency” proxy for the metal and mineral markets. China has been a huge importer of copper. If they take a break here, copper should also.
If copper’s rise slows right here and begins to consolidate, it will suggest that the resistance above the 3 dollar area is still in effect. And look at price. It’s sitting on top of the blue channel line. This will be a tough line to stay above. As long as it does, it is displaying incredible strength and we should stay with it. But a dip back into the channel and then a failure trying to get back above that line (where it becomes resistance) might be a good clue to suggest the seasonal pullback into late fall is taking effect.
Conclusions
The seasonal change coming and the chart resistance would suggest that an interim peak in copper should be developing over the next four weeks in the price area of $2.95 to $3.35. From there, we would look for a pullback to the bottom of the blue channel line around the $2.25 – 2.50 area sometime late in the fall or very early winter would be the seasonal tendency for this metal.
Crude Oil
How about Crude oil? Things have been very choppy lately. Are we peaking? Interestingly, if we look at the seasonal chart, we can see that crude oil usually has a very choppy August, with up and down and sideways action. The good news for the bulls is that the Crude oil market still has about another 6-8 weeks left of its seasonal action. (NOTE – Do not follow the yellow months. Those are Futures Contracts. Follow the blue months at bottom of chart.

In the crude oil chart below, we see the same meltdown of 2008 as we did in Copper. But other than that, the chart is following seasonality “this year”. But let’s look at what happens when “seasonality” inverts. You can see we bottomed in February of 2008 in February and we rallied to April. So far so good. But instead of pulling back into July and making a low, look how we exploded up and made a high in July. In fact, crude oil was the “MEDIA BOY” at the very peak. That its final ascent was a seasonal inversion will be something to keep an eye out for when we watch other inversions in the future. But that was it. When everyone got back home from July 4th vacation it was the end for crude as it virtually collapsed.
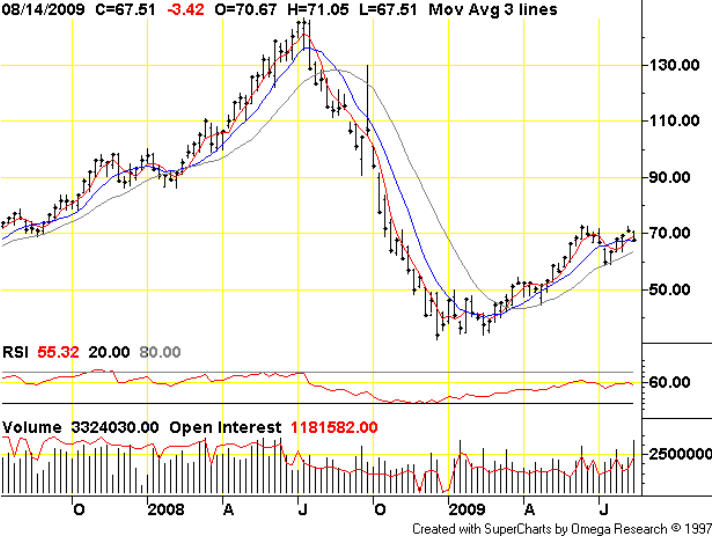
By time crude stopped plunging it was December. A look at the seasonal chart shows that the lows for crude are the December and the February area time period. Look how crude made a December low and moved sideways right to the last week of February and made its lows at the 33 area. Thus this year’s oil bottom was right on time as far as the seasonal goes. The pullback from April to May developed, but May was very strong and seasonally, it’s usually a sideways market. This is a sign of strength. And how about the July low in crude? On the chart the pullback did not begin until June (very late) and it lasted only 4 weeks. This was another sign of strength. And so now here we are in the middle of August and prices are knocking on the door of above 70 for the second time. Will Crude peak out here?
While it is getting late in the game, the seasonal suggests not yet. On average, the peak is not due until the October time frame. But we want to be on guard when price slows.
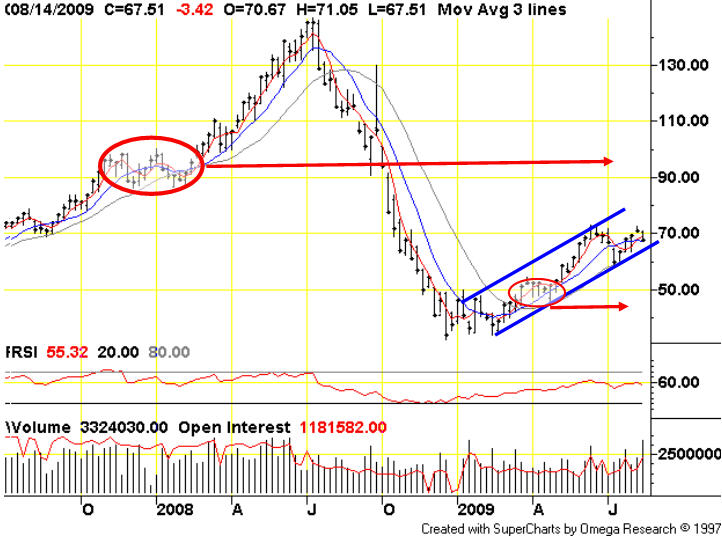
The crude chart above suggests that RESISTANCE is the 90-100 dollar area. I’ve highlighted the area from late 2007 where that resistance or pressure point area exists with a red circle and have drawn an arrow towards that resistance point that is coming up. Should the rally continue odds favor a peak near or at that area and then a pullback into February?
At this time we are in an uptrend channel as price is within the blue channel lines. As long as price remains above the trend line or the lows established in July, the trend is intact and odds will suggest higher prices. As we near the end of the seasonal, we always have to be on guard for weakness. For instance, notice how we recently made a double top in price just above 70. If we look to the very far left of the chart we can see that in August of 2007 price just happened to be where we are today…………..at the 70 area. Notice how that year had a small pullback in September before the rally into late October/early November. That pullback support was the 70 area, and as you can see we are encountering resistance at this price point also. But in 2007, it was just a pause, and small pullback before the next leg of the rally. When price finally did peak at October’s end, notice that the correction that began was sideways at best…….indicative of strength. Sure enough, prices started a rally right around the end of February where the seasonal suggests bottoms are usually made.
So what do we make of this rally? It is maintaining its uptrend momentum and velocity when it is inside the blue channel range. I’ve noticed over the past four weeks that we have been hanging around the bottom end of that channel and it would be nice (if you’re a bull) to see a thrust above 75. That would increase the odds that the September portion of the seasonal would be under way. Keep your eyes on the US Dollar also. Moves above the 80-82 area could put a lid on crude prices.
For now (barring a dollar rally), odds suggest that the rally is not complete. We have support at the 57-60 area should the blue channel line not hold price. Either one of these areas should provide support. Lastly, I’ve drawn another circle under the 50 dollar area. This area has a good chance of providing support for next year’s pullback near winters end.
Gold
Finally tonight we want to take a look at gold. Here’s the seasonal chart below.
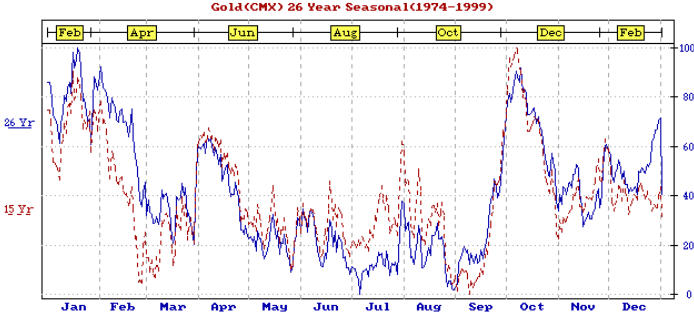
We can see that we are at a key time for the gold seasonal. Lows are usually made right at the end of August. Interestingly, we are only about 30 dollars above the July lows, and the choppiness we’ve seen in gold is actually what the seasonal suggests this time of year. What’s important for gold is what lies in front of us. September. You can see that a nice rally usually develops from somewhere in this time frame. The “optimum” time is about to arrive. Like the other commodities gold also went to the barber shop last fall. But unlike all other commodities, gold has returned to its highs……….a real sign of strength so far. I say so far because we must also conclude that gold has not made a new high for 18 plus months. Many are anticipating a tremendous rally should the highs succumb to price.
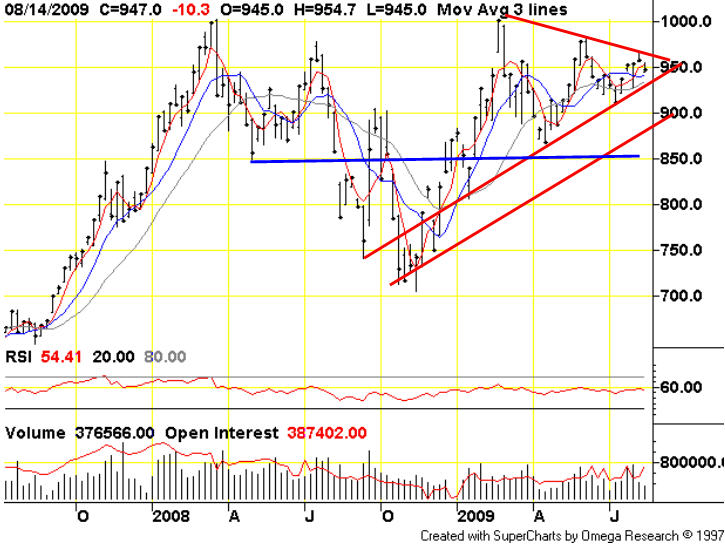
If the seasonal plays out then a rally is due to begin within two weeks and a September rally will ensue. One needs be careful however, as the metals are also well known for pullbacks in the October and November time frames. When gold is very strong it will bypass or only pullback slightly then and move into its winter peaks. However, in a normal year, gold has a decent pullback in that time period (Oct/Nov) as well.
The tremendous consolidation and current coiling action in gold makes us sure of one thing. A good sized move is coming up. I’ve drawn two key trend lines on the weekly chart above. As long as we are above those up channel lines, we should assume a fall rally. The end of August is notorious for a steep drop and reversal for gold. Keep your eyes open. Should there be a big thrust down towards the lower channel lines on the chart above, and then a subsequent reversal and turnaround back up in early September, then the odds will greatly increase that the fall rally is under way.
On the upside, traders and technicians are looking at this triangle formation that has developed on the chart. Moves above the 975-985 area would greatly favor an upside breakout and moves above the 1075-1100 would be indicative that the next leg of the gold market has begun.
Conclusions
The gold market is close to starting a good move. Many participants are expecting an upside breakout. While that may well be the case, make sure you keep your eyes on the downside too. The “inflation” scenario is a crowded one and the dollar bull is a rare specie at this time. While I won’t argue the inflation point, I want to see price confirm such an occurrence.
On the chart there are two channels that are PARAMOUNT to an uptrend support. There is also a blue horizontal line showing support at the 850 level. Should we begin to break these red trend lines, especially the lower one, it will be a warning to gold bulls that all is not right underneath. This is especially important this time of the year as gold is usually strong after August. Should a drop occur in the next few weeks that hold’s any of these support areas, it just might end up being the low before the fall rally. However, any break of the 850 area would be a warning shot across the bow that gold’s seasonal move would be in serious trouble. So keep your eyes on the 850 – 880 – and 925 area in gold.
If these support areas hold and gold breaks above the triangle lines and 975- 985, the upside will be the odds favored move in the coming months.
Closing thoughts
While copper and oil have led the charge since the lows in commodities, the seasonal price averages of these commodities suggest that first copper and then oil should hand the baton over to the gold market at some point in time this fall and take a break while gold leads the pack up.
Since we live in strange times, one needs to be aware that a US Dollar rally could squelch these commodities should it embark on a rally. Interestingly enough, the dollar index is at a key spot on its chart. Should the dollar move above the 80 area, and then the 82 area, oil, gold and copper will have a lot of potential price pressure put upon it. If you do venture into this area, keep one eye out for the US dollar and moves above the 80 area on the index.
If you would like to receive Free Gold Analysis please visit my site: www.TechnicalCommodityTrader.com
By John Winston
John Winston is the technical commodity trader analyst. He provides detailed technical analysis for popular commodities like gold, silver, copper, oil, and natural gas. By focusing strictly on these commodity price movements trading become strictly technical and simple to trade. His free trading reports are available at his website: www.TechnicalCommodityTrader.com
Contact John at: Info [@] TechnicalCommodityTrader.com
© Copyright John Winston 2009
Disclaimer: The above is a matter of opinion provided for general information purposes only and is not intended as investment advice. Information and analysis above are derived from sources and utilising methods believed to be reliable, but we cannot accept responsibility for any losses you may incur as a result of this analysis. Individuals should consult with their personal financial advisors.
© 2005-2022 http://www.MarketOracle.co.uk - The Market Oracle is a FREE Daily Financial Markets Analysis & Forecasting online publication.


