Is Silver Overvalued, Undervalued or Priced Just Right?
Commodities / Gold & Silver 2009 Aug 12, 2009 - 07:39 AM GMTBy: Bill_Downey
 From an investor standpoint the merits of owning physical silver has been laid out a number of times over the pages of the internet by some very astute analyst's who follow the metals markets. While physical silver is not new, it has recently come into vogue over the past few years as investors more and more are seeing the folly of fiat currency and those who control it and therefore turn to the gold and silver markets as a means of preserving wealth and purchasing power and yes, of course, speculation.
But for this update we are going to take a good look into silver and its price chart. To do that were going to look at what the daily/weekly and monthly charts say about this precious metal. And we're going to tackle the most important question an investor who is considering purchasing physical or any silver has. And that question is:
"Is silver overvalued, undervalued or priced just right?"
We are going to use the Silver ETF not only because it provides volume and good speculative investor trends, but it also acts as a continuous price chart.
For those who have yet to purchase silver or for those who are contemplating it, and those who know they should buy it but are hesitating, or to those who are thinking of adding to their positions, the decision to buy silver comes down to a price perspective. They see that price dipped all the way down under 9 dollars last November and when we observe the $14.50 cent price tag today, it can be difficult to purchase at that price. As investors we want to purchase when it is undervalued or worse case (if we must have it) when it’s priced just right to its relative value. And that's where the differences can come in.
Everyone has a value they would like assign to silver so as to determine its worth in dollars. I get questions like what do you think silver should be worth? Or what is the medium term outlook for silver? What price do you think silver will be at in ten years? Do you think silver will do well as an inflation hedge? These are all good questions of which there is a difficulty in answering. Why? Because it all depends on how you look at the numbers.
For instance, silver traded at $1.00 an ounce in the 1800's and at $3.60 in 1994. Not much of an inflation hedge there is it? Or how about silver having gone from $3.60 per ounce to $15 since 1994. Now that's much better. A much better inflation fighter when looked at it from that time perspective. As you can see from the above example, TIMING is a most important aspect of a commodity purchase. And because we cannot see the future price, only the past, it is very difficult to understand if a commodity is overpriced or underpriced. In hindsight, $4 dollar silver was grossly undervalued. The problem is paying $15 for it today can seem expensive. But is it?
While there are many theories about price patterns on charts that can suggest a big move coming and there might be compelling fundamentals about the future price of silver, the reality of today is the price is currently near 15 dollars. While $100 dollar silver may be in our future, right now 15 is what is being paid. And so the savvy shopper wants to know how good of a bargain Silver is at these prices. The good news is that it’s not overvalued, and the bad news is that its not UNDERVALUED.....at least not the way I've measured it for this report as it relates to price trends and market purchases. In this exercise, we want to look at what PRICE has to say about ITSELF.
It just so happens that from a technical perspective as it relates to price, silver has reached medium term equilibrium. For the investor/speculator it simply means that silver is fairly priced. And how would we quantify that? While there might be many ways one could try to arrive at fair value, but why not let the market decide what fair value is. It does so anyway. And regardless of what price has been or what it will be, the only way to PARTICIPATE right now is to use TODAYS PRICES. There is no other market price with which to enter or exit TODAY. And the way I chose to evaluate price in this exercise is with some moving averages I have put together.
The averages listed below represent the intermediate, medium and long term average price. Notice how all of the averages are bunched together. And more interestingly, look how there are PRICE GAPS right at and around those moving averages. It may suggest the averages have significance, especially at this price area.
What do the moving averages tell us?
Well first off, the Blue moving average is an intermediate term average that shows the average price for the past 4 months of silver has been about $13.65 per ounce. The Red moving average is a medium term moving average and its length is about a year and a half. This shows the average price for silver in this time frame at about $13.33 per ounce. Finally, the last moving average, the green line long term moving average covers about 2 years and four months. That price is currently at $13.97. Therefore, anyone who has bought silver in the past few years has averaged about $13.97 per ounce for his/her purchase. In other words, for our current investment purposes silver is not far from its FAIR MARKET VALUE. In fact, it was there a few weeks ago, a few months ago, and a few years ago. So now we have a perspective which we might use to ascertain the relative fair market value for silver…………using its average over the past few years.
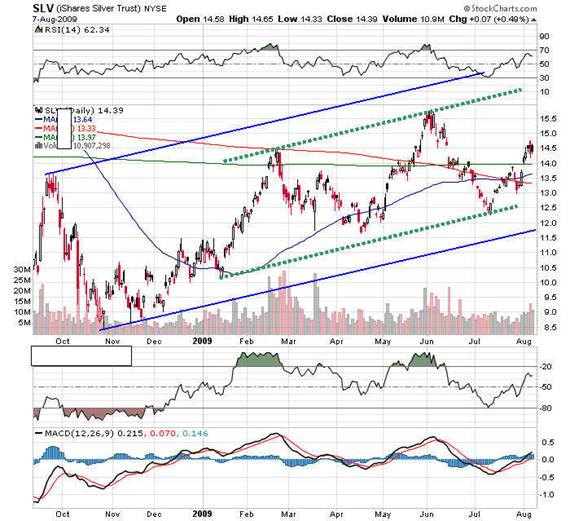
What else does the price chart relay to us? Well, certainly that we are in an uptrend since last November. But the price uptrend has been very choppy and price is just about where it was at last winter's highs. History suggests that in a "bull" market mode, the price patterns of silver would not overlap as much as they do on this chart. This is not to say that silver cannot be in a bull market, but that the price characteristics of the pattern leaves open the possibility that it could sustain a correction should the world economy continue to contract and should industrial demand fall off a cliff. Obviously a financial panic would wipe that thought out right away…..as silver would either head to 50 or to 8 depending on your perspective. One interesting aspect is that the Fast (blue)moving average is ABOUT TO CROSS ABOVE THE medium (red) and slow (green) moving average. This condition is known as a “cross” in technical terms and has bullish connotations. Should the fast (blue) moving average cross above the slower moving averages, it would INCREASE the odds that a new up leg in silver has begun. It has been almost a year since this fast moving average was above the other slower averages. So, it is an important development to keep an eye out for.
Now on this chart we are taking a view from last November, not last century. So while silvers range within the channel is wide swinging, it is not that big in the context of how silver fluctuates.
As you can see by the dual channels I've constructed, silver is also right in the middle of its price oscillations. During the month of June when Silver corrected I had anticipated a correction down to the 11.60 to 12 dollar area, but silver ended it's correction at the 12.38 area. Thus the reason for the dotted channel lines is silver has not pulled back to or reached the blue channel trend lines that were constructed off of the final Oct/Nov 2008 last down wave. So silver's pattern is tracing out a dual support within this channel and I want to track both to see which one will be in effect. Right now the dotted green line channel is in effect.
Silver is at a very important resistance area. Price is sitting at last fall’s highs, and last winter’s highs. Therefore the real BULL test is here for SLV---------the 14.75 to 15.60 area. A move above the 15.75 area will GREATLY INCREASE THE ODDS that silver is going to go after the top of the channels at the 17-18 dollar area or maybe even the 21 dollar high from 2008. BUT in order for that to occur, the INFLATION scenario and not the DEPRESSION scenario is going to have to play out. To make it much simpler……..ODDS SUGGEST if the US DOLLAR rallies, silver and gold will correct. So it might just be easier to watch the dollar. If the dollar is trading above 80-82, silver and gold will have a tuff time gaining ground. Right now, its just below 80 and right under the 50 day moving average.
From an investor standpoint, one with a longer horizon, using the above method of value rating, we conclude that silver is fairly priced. Thus purchasing some here might work out just fine, but you might consider keeping it lighter and saving some ammunition for when silver is underpriced too.
As far as the medium term and long term outlook for silver, the prospects are good. The demand/supply picture looks good and there are more and more uses being discovered for silver. Even then, a smart investor will try and time the bulk of his purchases when prices are undervalued. Should the current long term trend continue up, then looking to purchase silver in the 10.50 to 11.50 area might be considered undervalued. Even under 12 would be a good beginning. Now this well and fine if you’re a silver bull and you have convictions that the metals are going to go higher.
If you follow various newsletters you know that some analysts are projecting for silver to return to the 8 dollar area. Is there anything that would predicate such a move? Yes, there are a few. Should the markets go back into a meltdown phase as was witnessed last year, odds would suggest the metals would react in the same manner as the first time. And that would be down. Should there be a depression, then yes, the metals could move lower. Should the US DOLLAR bottom here, then the metals might not rally as everyone expects. To me the fact that everyone expects inflation certainly makes me ponder whether everyone can be right. But there are always going to be risks in any investment. That is why it is important to know when major trend changes do occur.
Additional Data for potential gain in the intermediate to medium term:
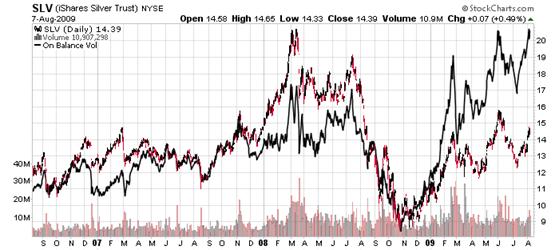
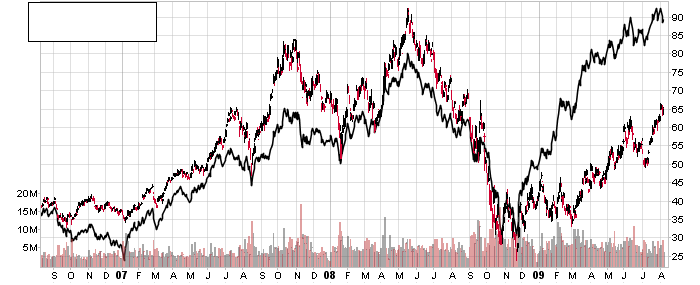
On the chart below, you can see a black line overlaid on price. This indicator looks at the DEMAND POWER by measuring if investors are buying more SLV at the market price or are conservative and buying the bid price. You can see that during 2007 and 2008 that the black line was always under the price. Thus buyers on average were only willing to buy at the bid price or under the market. But here in 2009, buyers are OVERWHELMINGLY paying up and buying at MARKET asked prices. Look how wide the swing has moved to in SILVER and how the black line is way above the price. What does this suggest? All I can do is provide a similar situation I saw in a mining stock last year.
Let’s look at this mining stock chart that had the same characteristics last December. Notice how the chart below had the black line move above price for the first time in early 2009? Scroll down to see results 9 months later on the same chart.
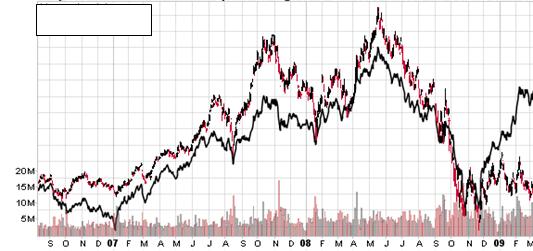
We can see that this stock had a sizeable move over the course of nine months as the black line has continued higher. Thus the fact that SLV is going thru the same technical conditions tilts the ODDS in favor (pullbacks aside) that silver could in fact be gearing up for a good rally this fall. That is of course assuming that investors will continue the current trend. Have I seen this pattern on more than just one stock ? YES. Does it always work? No. None do. At least not that I have found. This one is pretty good. Put it this way, the development is worth watching and I will be tracking it over the next few months.
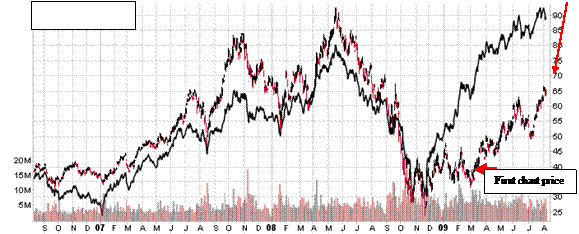
Long Term Silver
Our final chart tonight is the monthly silver chart. The long term trend is intact and brandishes two different channels with different slopes.
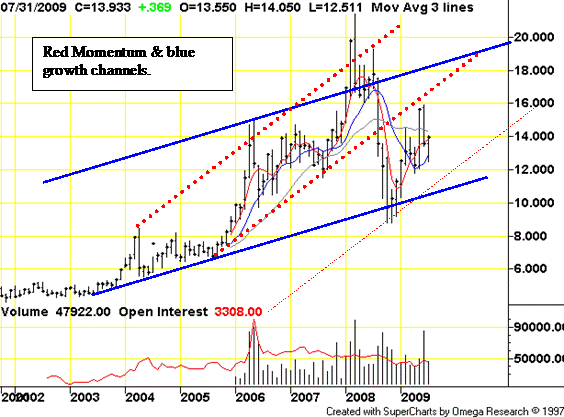
These channels represent long term resistance for this bull market. We can see that the red momentum channel has a much steeper slope than the blue channel. When price gave way during 2008 so did the momentum channel. In fact we can see that the first two monthly drops of the crash traveled the entire distance of that channel. More noticeable and important is the lows in late 2008 were penetrations of the lower BULL MARKET support channel line. But that channel line held the monthly closing price and a bottom formed providing a great buying opportunity for silver. When these lower levels are hit, and it’s not often, it is then A SILVER bull wants to make a good purchase in size. Now if you are in the belief that silver is about to explode above those channel lines, then that is a different story.
From this chart we can infer that as long as silver maintains a monthly price close above the bottom blue channel line, the long term trend is up. Overhead resistance to price rise is the bottom of the red channel line at around the 17 dollar area and the blue channel line just above 18 dollars. We also see that the peak at 21 shows how silver was trying to support at the top of the upper blue line and penetrate the top red line. But the rising slope was too much to overcome and silver collapsed during the 2008 meltdown.
On the monthly chart, we can see how the fast moving average (blue) line provided support on the latest drop as the first line of support. Each monthly low during the latest pullback was supported at or near this moving average.
Additional support is the 11.60 -12.38 area (spring and summer lows) and then the bottom blue channel line that rests above the 10.50 – 11.00 dollar area.
Conclusions:
Long term silver continues its decade long uptrend and is well in the confines of its growth channel. A new channel with a greater slope is trying to establish itself. Should we get a big rally in silver, we expect this channel to provide the major support and resistance areas. Odds continue to favor the upside for silver longer term, but one cannot overlook the potential to touch the lower channel lines every now and then. One thing is for certain. If the calls for 100 and 200 silver are correct they are going to have to go thru THESE UPPER channel lines in order to get there. If and when these channels get broken to the upside, then I will entertain and take a new look at price potentials. Because that will be the “sweet” spot and price above 22 bucks would probably go parabolic. The first clue will be price moving out and over the blue channel line. Until then, we will need to stay focused on the highs at 21 and continue to be cautious of an “all” markets rout like 2008 and maintain a guard on our long positions. Catching the next TREND AND REAL BREAKOUT will be the key to success.
Barring a great depression or another financial meltdown, the prospects for silver look good. There are some expert wave analysts who still project one more huge drop in silver. Should silver begin to close below the tiny red channel line just above the lower blue line near 11, and then below the blue channel line, then the medium term prospects of silver will need to be re-evaluated and the bearish projections of some analysts will have potential. Until we start closing below the 11.60 to 12.00 area, its best to keep focused on the upside. The key is to always have a portion of your money waiting should such an opportunity arise.
The fall rally season is UPON us this time of year. If the inflationist’s are correct then silver should begin an up move as early as this month and as late as October. August is a pivotal month for the metals and one should be prepared for good swings if he/she wants to play the silver market. Many fall rallies have developed in this time frame.
Should the deflation boys decide to show up the first hint will be that the US dollar would start rallying. Although many don’t give this a high percentage event status, no one else is left to go bearish. Everyone already is. And that can be a problem. There are a lot of dollar bears and a lot of silver bulls. If there is one adage in commodities that need be respected, it is the phrase “Never, say never.”
The channels will be our trend guide, and as long as they are up sloping and price is within their boundaries, the uptrend is intact. But should the dollar begin to close above the 80-82 area, and should the economy not pick up and start heading south again, and should the markets one by one reverse lower, expect silver to follow them. While silver has the status of monetary value, its industrial value and USAGE is an important element in the shorter term picture when it comes to silver prices. So keep your eyes on the stated targets in the coming month.
If you would like to follow along with daily, weekly and monthly readings as well as commentary with regards to the gold and silver market and the key support and resistance areas where trend changes are defined, you can visit my FREE website, where there is no registration or log-in required at: http://www.goldtrends.net/
May you prosper
Bill
Bill Downey is an independent investor/ trader who has been involved with the study of the Gold and Silver markets since the mid 1980’s. He writes articles for public distribution for other newsletters and websites as well as his own free site at: http://www.goldtrends.net/
Email: Goldtrends@gmail.com
© Copyright Bill Downey 2009
Disclaimer - The opinion expressed in this report is the opinion of the author. The information provided was researched carefully, but we cannot guarantee its total accuracy. The report is published for general information and does not address or have purpose or regard to advise specific investments to anyone in the general public. It does not recommend any specific investment advice to anyone.
© 2005-2022 http://www.MarketOracle.co.uk - The Market Oracle is a FREE Daily Financial Markets Analysis & Forecasting online publication.


