Higher Interest Rates Reflect Default Risk as Credit Boom comes to an End
Interest-Rates / Liquidity Bubble Jun 14, 2007 - 02:54 PM GMTBy: Paul_Lamont
From our last report on the Panic of 1837, titled ‘ May 10th Credit Collapse ':
“In late 1836, the Bank of England concerned with inflation raised interest rates. As rates rose in England, credit tightened, and U.S. asset prices began to fall. On May 10 th , investors panicked and scrambled for cash.”
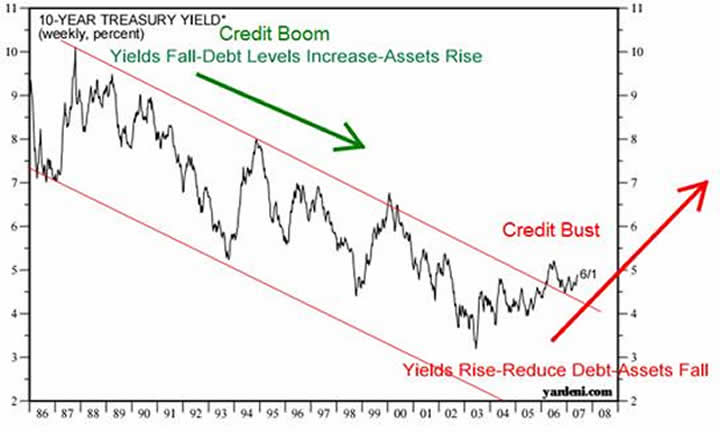
The markets are now tightening credit with higher interest rates. The 10 year Treasury Bond has recently confirmed its break out of the 1982-2006 trend channel.

This movement caused Bill Gross, manager of the world's largest bond fund to remark that he's “now a bear market manager.” He also asked investors to consider:
“These increases in rates over the past few days have placed the 30-year mortgage market at close to 7% in conventional terms…This will decimate the housing market if it wasn't already decimated before, and certainly put the Fed on hold, and maybe allow the Fed to reduce rates…six to nine months from now.”
To financial historians, the increase in bond rates comes as no surprise. At the end of every credit boom, there has always been a realization point that the debts (yes, even mortgages) accumulated during the boom have become unsustainable. Interest rates (the cost of debt), then rise to reflect the increase in default risk.
The Last Time This Happened
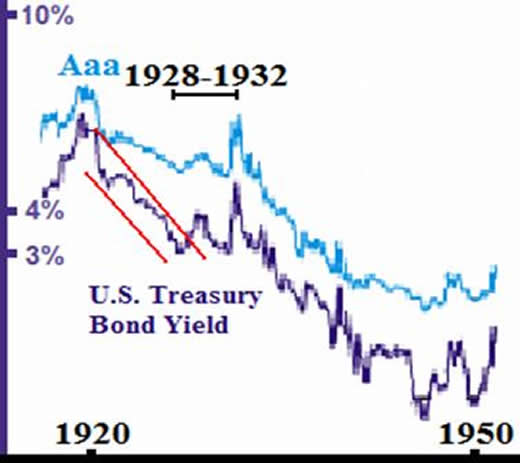
The historical chart below comes from data from Ian Gordon: www.thelongwaveanalyst.ca. During a period of falling interest rates from 1920-1928, a credit boom contributed to speculation in subdivisions, Florida beachfront properties, skyscrapers, and most famously stocks. In 1928, the U.S. Treasury Bond similarly broke out of the channel and rose to a higher yield. This coincided with the end of ‘easy' money which forced the deleveraging of the economy and concluded with the financial crisis of 1929-1932.

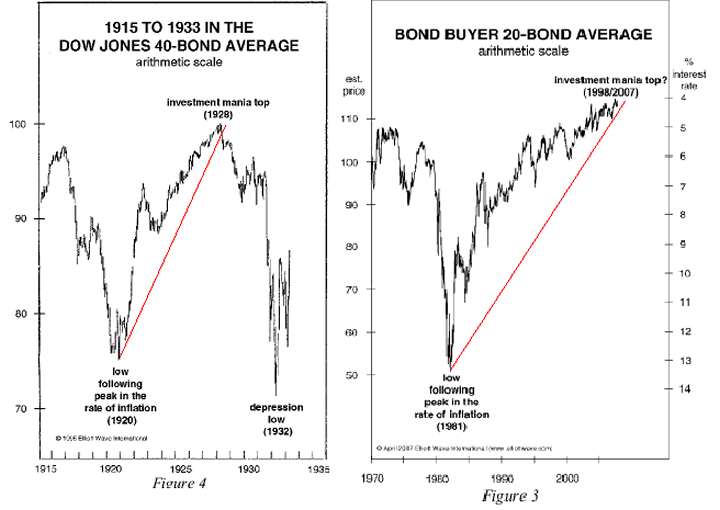
To see a striking comparison of the two periods, see the Bond Buyer 20-bond Index below, which is a composite of long-term municipal bonds rated A or better. This chart, provided by Elliotwave.com, is in price, so a fall reflects an increase in yield.

With debt becoming more expensive, leveraged assets are less profitable or unprofitable to hold. So assets are sold and price falls. With the drop in price, more leveraged positions have to be liquidated. The vicious cycle feeds on itself until the debt is destroyed. This is what happened in the forced selling of positions to cover margin calls in the 1929 stock market crash. It is now manifesting itself in the foreclosures on U.S. real estate. As we reported in May 10th Credit Collapse , $1 Trillion dollars of ARM's will be resetting to higher rates over the next 5 years. The margin calls are coming due.
Couldn't The Fed Prevent This Today?
Common perception is that the Federal Reserve could somehow stave off the credit bust. Let's take a look at their track record. Murray Rothbard, in the A History of Money and Banking in the United States describes the action of the Fed in 1931:
“The Fed promptly went into an enormous binge of buying government securities, unprecedented at the time. The Fed purchased $1.1 Billion of government securities from the end of February to the end of July, raising its holdings to $1.8 Billion. The Fed, under Meyer, did its mightiest to inflate the money supply-yet despite its efforts, total bank reserves only rose by $212 million while the total money supply fell by $3 Billion.”
Why wasn't this successful? He continues: “The more that Hoover and the Fed tried to inflate, the more worried the market and the public became about the dollar, the more gold flowed out of banks, and the more deposits were redeemed for cash.” So the Federal Reserve can print money, but it cannot create credit or confidence. ‘Money' is therefore hoarded, by either the public or the banks themselves (if they are concerned about an increase in redemptions).
***As we go to press: A Bear Stearns' Hedge Fund: High-Grade Structured Credit Strategies Enhanced Leverage Fund is “scrambling to sell $4 Billion in mortgage-backed securities to prepare for investor redemptions and margin calls.” According to BusinessWeek, the highly leveraged fund is down 23% this year (April losses at 18.97%) due to bad bets on subprime. Because of its lack of cash, it has currently suspended redemptions. One investor, who had been trying to get out since February, commented: “At the end of the day, I'd like someone to be honest with me about what's going on.” In a June 8 th conference call, Bear Stearns responded with: “We are not taking any questions.”
Our Position
We have been advising over the last 7 months to sell assets as this credit boom comes to an end. It is always better to get out with cash profits than to have your funds frozen or stuck in bankruptcy. Therefore we continue to recommend to investors to sell assets and hold interest-bearing cash at a secure financial institution. For more about our investment management services, visit our website . Starting in July, our monthly Investment Analysis Report will require a subscription fee of $40 a month. Current subscribers should have received their PayPal invoice for half price ($20 a month). To sign up for our Investment Analysis Reports subscribe at FeedBlitz.com .
By Paul Lamont
www.LTAdvisors.net
Copyright ©2007 Lamont Trading Advisors, Inc. Paul J. Lamont is President of Lamont Trading Advisors, Inc., a registered investment advisor in the State of Alabama . Persons in states outside of Alabama should be aware that we are relying on de minimis contact rules within their respective home state. For more information about our firm, or to receive a copy of our disclosure form ADV, please email us at advrequest@ltadvisors.net, or call (256) 850-4161.
Paul Lamont Archive |
© 2005-2022 http://www.MarketOracle.co.uk - The Market Oracle is a FREE Daily Financial Markets Analysis & Forecasting online publication.


