SPX Post Crash Pattern Same as Nikkei, History Repeating
Stock-Markets / Financial Crash Aug 10, 2009 - 12:06 PM GMTBy: Captain_Hook
 Just about everybody has heard the truisms ‘history repeats’, and if this is not true ‘history rhymes’, however it’s been my observation that a far as present day stock market participants are concerned, not many take the validity of these statements as seriously as they should. After all, people are people right, even if they were acting in the context of another era, and in this case, other market bubbles. This is the important understanding that many are missing you see, that people are no different in the way they react to extreme market conditions (stress) today than they were during previous post crash episodes, including those that inspired Charles Mackay to pen the timeless Extraordinary Popular Delusions And The Madness Of Crowds all those years ago now.
The following is an excerpt from commentary that originally appeared at Treasure Chests for the benefit of subscribers on Tuesday, July 28th, 2009.
And while exact details and patterns can for the most part only rhyme in full measure, without a doubt this is one of those instances where you do want to ‘sweat the small stuff’, because in doing so one would be missing close enough approximations to model future trading decisions on that have proven very profitable indeed. Or at a minimum, such information, if believed, could have prevented trading losses for those who attempted to capitalize on the recently foiled head and shoulders pattern that characterized the major averages. Many unknowing speculators attempted to do so and lost money, which is of course common when trades get crowded in mature markets. The markets become like casinos you see, with the house (knowledgeable speculators) having the advantage.
Now you might be thinking I am referring to the boys down at Goldman Sachs here, where as mentioned the other day it appears they front run the Uncle Sam accounts so that when they are executing the bureaucracy’s wishes, they make big profits in the process. But no, I am not referring to these guys as being knowledgeable speculators. If left out of the bureaucracy’s loop, these guys would likely loose money, as it’s probably been ‘too easy for too long’ being plugged into the information pipeline from Washington. No, I am referring to you and me, guys who do our homework, and stay sharp, as it’s the laws of the jungle for everybody else outside of the loop.
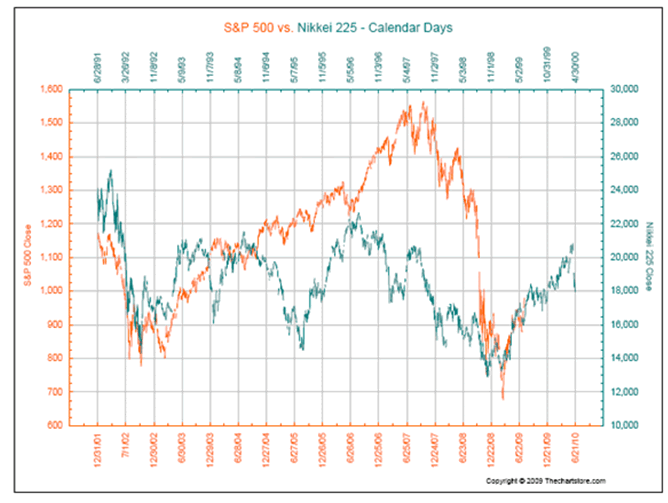
Along these lines, and in following up on which historical pattern would dominate from last week, it appears the winner was Figure 2, courtesy of continued gains in the stock market. And as you will see below, if we see more gains this week (and possibly next), which appears likely at this point, then, as opposed to history simply rhyming in this case, we could have an exact pattern match between the S&P 500 (SPX) and post crash pattern of the Nikki measured in calendar days. What’s more, and to frame this in the proper context as per above, it appears in terms of the high degree events we are working with these days, history is repeating right on schedule if that’s possible, making our job as speculators far easier in terms of positioning decisions. (See Figure 1)
Figure 1

Source: The Chart Store
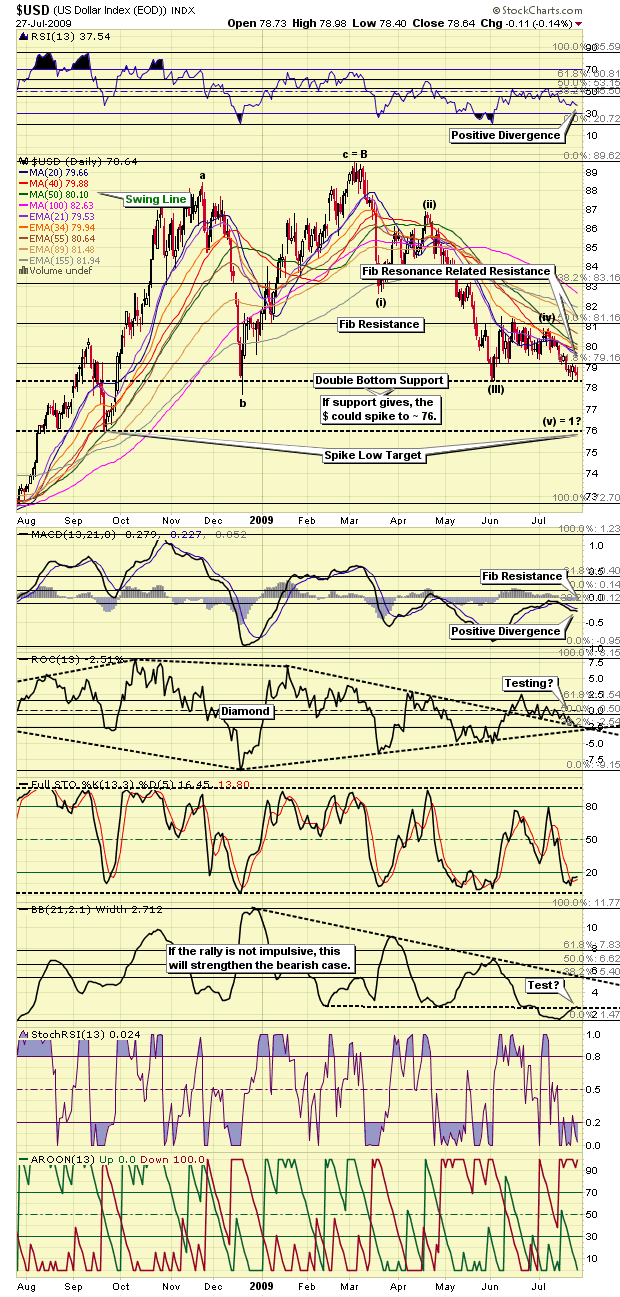
As you can see above, if the pattern match is to persist, then the SPX should see the large round number at 1,000 breached as we move into August (the first few days of a new month are usually strong due to window dressing overlap and systematic fund buying), only to end up consolidating under the mark for several months before gaining enough steam to sustain a move above this key resistance level. So, since all equities appear to be joined at the hip, with the dollar ($) central in the story, it appears support at 78 should be breached this week, with a spike down to 76 likely in reaction to this, followed by a tradable bounce afterwards considering the positive divergences in the indicators. (See Figure 2)
Figure 2

One thing is for sure, if the $ doesn’t break lower this week with the Treasury issuing almost a quarter trillion in bonds, then the extended five-wave sequence in the $ will fail, and not only will the bounce start sooner than anticipated, but also the historical pattern similarity in Figure 1 will go flying out the window, along with a good number of my long positions. So keep your eye on the almighty $ this week, and the success of US bond auctions, where a smooth showing would be just what the doctor ordered in terms securing the spike lower in the $ we are expecting. I see the $ is bouncing off support this morning, but don’t let that fool you. This is just traders getting nervous at what they think might be a double bottom.
Unfortunately we cannot carry on past this point, as the remainder of this analysis is reserved for our subscribers. Of course if the above is the kind of analysis you are looking for this is easily remedied by visiting our continually improved web site to discover more about how our service can help you in not only this regard, but also in achieving your financial goals. For your information, our newly reconstructed site includes such improvements as automated subscriptions, improvements to trend identifying / professionally annotated charts, to the more detailed quote pages exclusively designed for independent investors who like to stay on top of things. Here, in addition to improving our advisory service, our aim is to also provide a resource center, one where you have access to well presented 'key' information concerning the markets we cover.
And if you have any questions, comments, or criticisms regarding the above, please feel free to drop us a line . We very much enjoy hearing from you on these matters.
Good investing all.
By Captain Hook
http://www.treasurechestsinfo.com/
Treasure Chests is a market timing service specializing in value-based position trading in the precious metals and equity markets with an orientation geared to identifying intermediate-term swing trading opportunities. Specific opportunities are identified utilizing a combination of fundamental, technical, and inter-market analysis. This style of investing has proven very successful for wealthy and sophisticated investors, as it reduces risk and enhances returns when the methodology is applied effectively. Those interested in discovering more about how the strategies described above can enhance your wealth should visit our web site at Treasure Chests
Disclaimer: The above is a matter of opinion and is not intended as investment advice. Information and analysis above are derived from sources and utilizing methods believed reliable, but we cannot accept responsibility for any trading losses you may incur as a result of this analysis. Comments within the text should not be construed as specific recommendations to buy or sell securities. Individuals should consult with their broker and personal financial advisors before engaging in any trading activities, as we are not registered brokers or advisors. Certain statements included herein may constitute "forward-looking statements" with the meaning of certain securities legislative measures. Such forward-looking statements involve known and unknown risks, uncertainties and other factors that may cause the actual results, performance or achievements of the above mentioned companies, and / or industry results, to be materially different from any future results, performance or achievements expressed or implied by such forward-looking statements. Do your own due diligence.
Copyright © 2009 treasurechests.info Inc. All rights reserved.
Unless otherwise indicated, all materials on these pages are copyrighted by treasurechests.info Inc. No part of these pages, either text or image may be used for any purpose other than personal use. Therefore, reproduction, modification, storage in a retrieval system or retransmission, in any form or by any means, electronic, mechanical or otherwise, for reasons other than personal use, is strictly prohibited without prior written permission.
Captain Hook Archive |
© 2005-2022 http://www.MarketOracle.co.uk - The Market Oracle is a FREE Daily Financial Markets Analysis & Forecasting online publication.


