


Gold Closed Flat on the Week, Where Next?
Commodities / Gold & Silver 2009 Aug 09, 2009 - 08:27 AM GMTBy: Merv_Burak

 A little bit up, a little bit down but in the end getting nowhere during the week. Gold finished the week just about where it started although silver had a much better time being up 5.0% on the week. So, where are we now?
MOMENTUM
Before getting into this week’s commentary I thought I’d mention a few words (well, maybe a little more than a few) about the most overused word in the realm of securities analysis, that word being “momentum”.
As we all know, I use this word often in my own commentaries so I am not blameless in its overuse. But what does this word mean? When analysts, and others, use this word what is it that they are REALLY referring to? Is it earnings momentum? Is it sales momentum? Is it price momentum? Is it some other type of momentum? When I read or listen to a commentator, especially the media type, who mentions the word momentum, many times I have no idea in the world what he is referring to. I often think that he does not REALLY know himself, but it sounds intelligent. Most of the time I can “guess” what he means but am not 100% sure, and I’m an experienced technician and should know these things. Whenever you read or hear a commentator mention the word momentum, understand that he could be referring to many different things so do not assume what the commentator is referring to unless he has defined his reference. You may assume he is referring to a company stock trend but in fact he could be referring to the company’s sales or earnings growth. Your assumption may get you into financial trouble if you misunderstand the reference.
So, what to I refer to when I mention the word momentum?
Last week I mentioned that I look at three different indicators to define where gold stands. The momentum indicator is one of these three.
When I use the word momentum I am referring to the recent strength of a company’s stock price action, relative to an investment time period in discussion. The strength (or momentum) could be positive, the stock price effectively moving higher, or it could be negative, the stock price effectively moving lower. Whether positive or negative the strength (or momentum) of the move could be getting stronger or it could be getting weaker. These things are good to know. A good momentum indicator (such as the RSI) will provide this information about a securities price action for whatever time period one is interested in. Very often the indicator will telegraph ahead of time that the security price is about to change direction and one can then be on guard. One would not actually act on the information of the momentum indicator alone but would normally wait for a trend indicator (such as a trend line, or moving average) to confirm the information and then act.
GOLD
LONG TERM
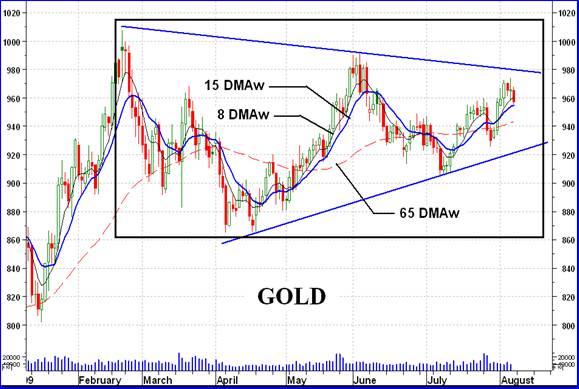
The megaphone pattern discussed last week, as seen on the P&F chart and on the bar charts, continues unbroken. It would still take more upside action to break through the upper megaphone trend line so it’s a waiting game at this time. Long term the P&F chart remains basically unchanged, as it has been for some time.
Gold went through a good 50% rally from its Oct low to its Feb high. Since then it has been consolidating its gain by basically moving sideways within a 14% band. The megaphone pattern suggests the band is getting smaller and concentrating around the middle of the original 14% band. This reduction in the band width cannot go on much longer and the price should get going one way or the other. The megaphone pattern suggests the move will be to the up side but let’s wait for the move to happen. In the mean time gold remains above its positive sloping moving average line and the momentum indicator remains in its positive zone above its positive sloping trigger line. As for the volume indicator, it is interesting. Although the daily volume activity leaves a lot to be desired the long term cumulative effect is quite positive. The indicator remains above its positive sloping trigger line and the recent action has taken the indicator well above its previous high from last Feb. For now there is nothing in the long term indicators to get too worried about and the long term rating remains BULLISH.
INTERMEDIATE TERM
The rally since early July seems to be ending without the price making a new recovery high, above the early June high. Although the action remains inside that megaphone pattern the common thinking is that a break-out from the pattern should occur about two thirds along the way towards the megaphone apex point. That’s just about where we are now. As the trend continues towards the apex point while remaining trapped inside the pattern, the eventual break-out becomes less and less powerful and loses its potential steam. About here would suggest the strongest break-out location.
In addition to the megaphone pattern we still have that “box” mention a few weeks back. Even should the price break through the megaphone it still has the box to contend with. Nothing is straight forward in the securities analysis business.
The price remains above its positive moving average line but looks like it might be heading back towards the line. The momentum indicator remains in its positive zone but here too it is starting to move lower. It has now moved below its trigger line but the trigger is still in a positive slope. The volume indicator, with its cumulative effect over the past few weeks, remains positive and above its positive trigger line. All in all, the intermediate term rating remains BULLISH.
SHORT TERM
Despite a little bump in this past week’s activity the short term is still intact. The price of gold remains above its positive sloping moving average line, although not far above. The momentum indicator is still in its positive zone although heading lower and crossing below its trigger line. The trigger is still positive in slope but may not remain so if we have another day or two of downside action. The Daily volume action has consistently been the indicator of most concern. Over the past few months the daily volume has decisively breached the 100,000 mark mostly on down days or on transition days to the down side. This is not good for any longevity of an up trend. However, having said all that, my indicators still combine to give me a BULLISH rating on the short term.
As for the immediate direction of least resistance, well I am tempted to go with the lateral direction but looking at the immediate trend and the actions of the aggressive Stochastic Oscillator (SO) I must go with the down side. The SO has moved below its now negative trigger line and more importantly has dropped below its overbought line after being inside the overbought zone for a few days.
SILVER
Up, up and away. Silver seemed to have a good week versus the performance of gold. Gold was up $0.20 (0.0%) while silver advanced $0.70 (5.0%). Quite a difference. However, silver looks to be topping out similar to gold’s action, except not as pronounced as gold.
For those following these commentaries everything I wrote last week about silver still applies. Nothing has changed in the indicators and all three time periods are rated as BULLISH. The only cautionary comment would be about that topping activity. The immediate direction of least resistance seems to have changed to the down side so, although things are still bullish RIGHT NOW that may change after another few days of downside activity if the topping should take hold.
PRECIOUS METAL STOCKS
Last week I showed a chart of my Merv’s Penny Arcade Index. The Index topped out in April of 2007, a year before the rest of the gold stocks. It bottomed out and reversed in the first week of 2009, a month or two after the rest of the gold stocks reversed. What this suggests, or confirms, is the oft stated message that the gambling stocks, the real pennies, top out long before the rest of the stocks and bottom out after the rest. One can then surmise that we do not have a bear market in progress in the majority of gold and silver stocks until the pennies have gone into their bear market and been there for some time. Well, this past week while most of the stocks hardly moved with the North American Indices generally up by less than a percentage point, the Penny Arcade Index moved up 5.0%. That is not the action of the gambling stocks that suggests speculators have given up and dumped the pennies. We are still far from a major new bear market in the gold and silver stocks if one goes with the actions of the pennies.
None of the Merv’s or North American major gold and silver Indices have yet breached their late May/early June highs, EXCEPT –
With the gambling and speculative stocks still not in a bearish mode (as none of the majors are either) the Merv’s Gold & Silver 160 Index is showing its fangs. It was the only Index that has now breached its previous late May high and moved into new recovery high territory. This seems to be propelled by the more speculative members of the Index as the top 100 stocks (by market value) in the Index are still some 2% below their previous high. Again, an indication the not all is lost in the gold stock market and more upside might be expected.
MERV’S PRECIOUS METALS INDICES TABLE
Well, that will be it for this week.
By Merv Burak, CMT
Hudson Aero/Systems Inc.
Technical Information Group
for Merv's Precious Metals Central
For DAILY Uranium stock commentary and WEEKLY Uranium market update check out my new Technically Uranium with Merv blog at http://techuranium.blogspot.com .
During the day Merv practices his engineering profession as a Consulting Aerospace Engineer. Once the sun goes down and night descends upon the earth Merv dons his other hat as a Chartered Market Technician ( CMT ) and tries to decipher what's going on in the securities markets. As an underground surveyor in the gold mines of Canada 's Northwest Territories in his youth, Merv has a soft spot for the gold industry and has developed several Gold Indices reflecting different aspects of the industry. As a basically lazy individual Merv's driving focus is to KEEP IT SIMPLE .
To find out more about Merv's various Gold Indices and component stocks, please visit http://preciousmetalscentral.com . There you will find samples of the Indices and their component stocks plus other publications of interest to gold investors.
Before you invest, Always check your market timing with a Qualified Professional Market Technician
Merv Burak Archive |
© 2005-2022 http://www.MarketOracle.co.uk - The Market Oracle is a FREE Daily Financial Markets Analysis & Forecasting online publication.