S&P 500 Stock Market Trends Analysis for August 2009
Stock-Markets / Stock Index Trading Aug 07, 2009 - 12:41 AM GMTBy: Hans_Wagner
 When analyzing monthly stock market trends, I use the S&P 500 charts to identify important trend lines. Trend following is a proven strategy to beat the market and grow your stock portfolio. Technical analysis provides the tools to analyze and identify trends in the stock market. Since the S&P 500 chart is the one used by professional traders for their analysis, it is important to understand how it is performing.
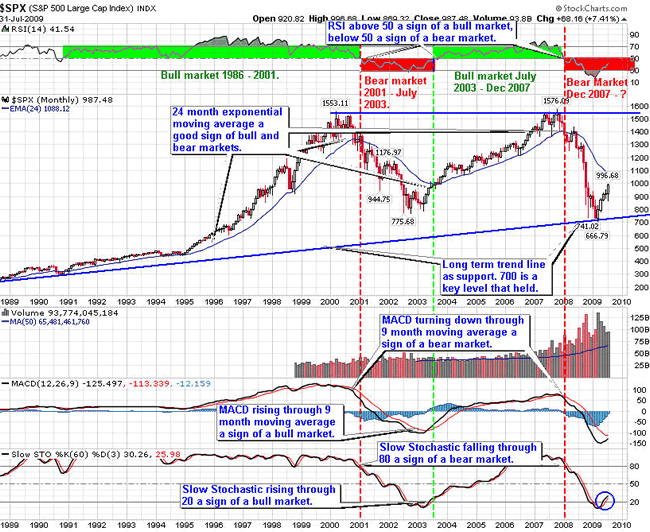
The analysis of the S&P 500 trend line starts with the 20-year monthly view of the S&P 500 chart. Next, we examine the weekly chart of the S&P 500 trends to get a shorter-term view. Finally, we analyze the one-year daily chart of the S&P 500 trends to get an even shorter-term view. On each version of the charts of the S&P 500 trend line, the view and the value of the indicators change, as we move from a monthly to a weekly and then a daily chart.
Starting with the monthly view of the S&P 500 trend chart, the bull market of the last five years turned down, as the index fell below the 24-month exponential moving average. The Relative Strength Indicator (RSI) is below 50, indicating a downtrend is in place. The Moving Average Convergence Divergence (MACD) fell below zero, a sign stock market trend has reversed and we have entered a bear market. Finally, the Slow Stochastic fell through zero, another sign of a bear market.
The analysis of the monthly trends of the S&P 500 chart shows we remain in a bear market with key resistance at the 24-month exponential moving average. In addition, support at the 25 year rising S&P 500 trend line has been tested and held, so far. However, the Slow Stochastic rose through the 20 level. If it is able to stay above 20, it is an early buy sign. The other indicators have not yet flashed an end of the bear market. From the monthly view, we remain in a bear market for now.

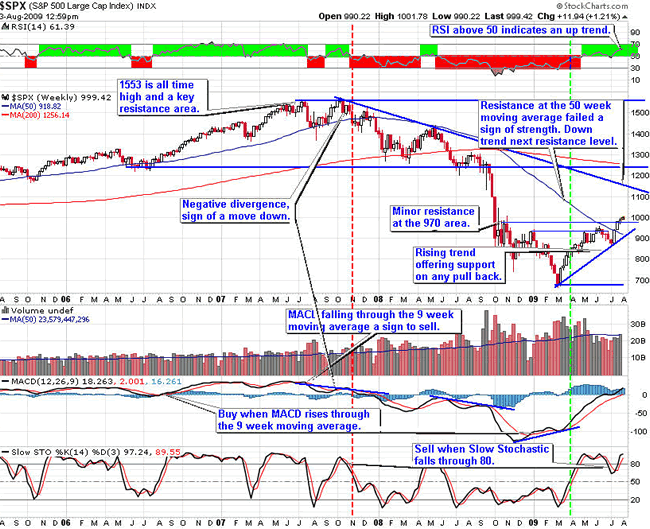
The three-year weekly S&P 500 trend chart shows more closely the transition from a bull to a bear stock market. So far, the descending trend is the primary resistance level for this view of the bear market.
Earlier this year the S&P 500 fell through support at the 800 level down to the 650 area. The S&P 500 trend then reversed course, generating a nice rally pushing through minor resistance at the 930 and 970 levels.
The 1,000 level is a psychological level that will offer resistance on the move up. If the S&P 500 can push through this level, the next resistance level is the downtrend.
RSI is above 50, a sign of an up trend. The MACD turned up through the nine-week moving average, a buy sign. It continues to rise indicating the up trend is still underway. Earlier the MACD showed positive divergence indicating the uptrend would begin in early March. Slow Stochastic turned back up through 80, a sign of strength. However, the Slow Stochastic is above 80 where it will eventually turn down giving a sell sign.
Long term, the trend of the S&P 500 chart is still down. The weekly pattern indicates the S&P 500 trend is more than 100 points from encountering the weekly bear market down trend. Support remains at the rising trend, though the slope is steep and unsustainable. The rally can continue for a while longer, though we should expect a pull back at some time in the next several weeks up to early October.

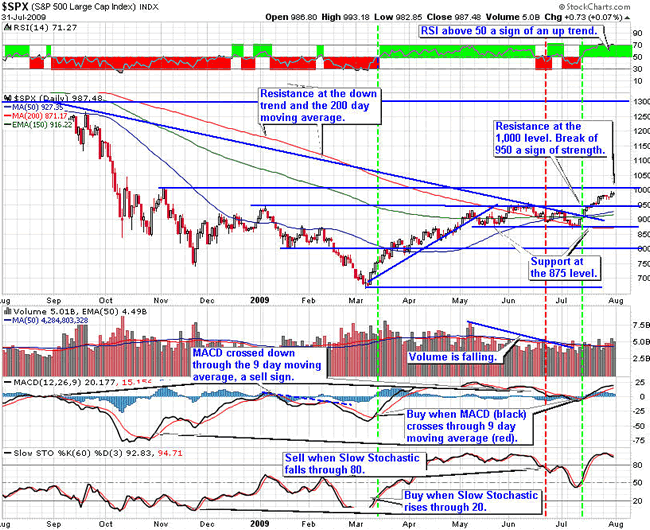
The daily S&P 500 shows the pause at the 950 level that began in late May. The break through the 950 level in July indicates the rally is continuing. The next resistance is at the 1,000 level, which is being tested. Average volume has been declining, though it is summer, when trading volume tends to decline.
RSI is above 50 indicating an up trend. The MACD turned up at the zero level, giving a buy sign. The Slow Stochastic rebounded at the 50 area, a sign of strength. It is now above 80, where it will eventually turn down, giving a sell sign.
The daily chart of the S&P 500 is the rally is continuing, though it is encountering resistance at the 1,000 level. The indicators are telling us the up trend remains in tact, though they are nearing high levels where they normally signal a down trend. It will be important to monitor the test of resistance at the 1,000, as well as the indicators to gain an understanding of how the trend proceeds from here.

The charts of the S&P 500 trend lines provide a good way for investors to align their portfolios with the overall market trends. Given this analysis of the S&P 500 trend line charts, it is important to have your portfolio positioned for the up trend to continue if it can break through the 1,000 resistance. It also is prudent to add down side protection and/or reduce your long positions on any sign the market might be turning down.
Bear market rallies offer investors a good time to buy stocks and ETFs in leading sectors. Look to buy on dips in the price of the S&P 500 trend charts on the next pull back. Be sure to use proper capital management techniques including trailing stops, protective put, covered call options and position sizing. When the pull back ends, look to add to long positions with stocks and ETFs from the sectors that are likely to outperform the overall market. Keep in mind, Warren Buffett's first rule of investing is to not lose money. Be patient waiting for good entry points.
By Hans Wagner
tradingonlinemarkets.com
My Name is Hans Wagner and as a long time investor, I was fortunate to retire at 55. I believe you can employ simple investment principles to find and evaluate companies before committing one's hard earned money. Recently, after my children and their friends graduated from college, I found my self helping them to learn about the stock market and investing in stocks. As a result I created a website that provides a growing set of information on many investing topics along with sample portfolios that consistently beat the market at http://www.tradingonlinemarkets.com/
Copyright © 2009 Hans Wagner
Hans Wagner Archive |
© 2005-2022 http://www.MarketOracle.co.uk - The Market Oracle is a FREE Daily Financial Markets Analysis & Forecasting online publication.
Comments
|
Adrian
12 Aug 09, 02:21 |
The coming stock market crash
Fasten your seatbelts. This is the week a crash was predicted thirteen years ago: http://www.luckydays.tv/coming-stock-market-crash.html |


