Stock Market Bubble-Mania in China Spreads to Global Markets
Stock-Markets / Financial Markets 2009 Aug 04, 2009 - 06:46 PM GMTBy: Gary_Dorsch
 The S&P-500 Index, a global bellwether for the world stock markets, extended its best five-month winning streak since 1938, by advancing through the psychological 1,000-level, and is up nearly 50% from its 12-year low set on March 10th. The S&P-500 gained 7.4% in July, its best monthly performance since 1997, even as average earnings per-share tumbled -32% and sales slid -16% from a year ago.
Industrial commodities, often viewed as barometers for global economic trends, have also moved sharply higher. So far this year, copper has soared by +96%, nickel is up 62%, and zinc is +50% higher. China, which buys two-thirds of the world’s seaborne iron ore shipments, boosted imports 30% in the first seven-months of this year to 353-million tons, lifting its spot price to $91 /ton, up from $60 per ton in February. Crude oil rose above $71 /barrel this week, doubling in value since December.
In hindsight, while the “Group of Seven” (G-7) economies in North America, Europe, and Japan, were experiencing the most severe economic contractions since the Great Depression of the 1930’s, coupled with unemployment rates ratcheting upward to multi-decade highs, the emerging economic giant, - China, was demonstrating its prowess, with the most ambitious stimulus plan the world has ever seen, to rescue its juggernaut economy from the brink of social disaster and unrest.
In a little more than nine-months, the pendulum of investor sentiment in Asia has swung from the extreme of terrifying panic and fear, to the opposite side of the emotional spectrum, - hope and unbridled greed. The Shanghai stock market index has surged +90% this year, owing its good fortune to 1.2-trillion of bank loans clandestinely funneled into the stock market by brokerage firms, leaving it awash with yuan and lifting share prices above what economic reality can support.
China’s ruling Politburo is demonstrating to the world, its command and control over its stock market and economy. Over past few-years, Beijing has proven its ability to either massively deflate a stock market bubble, as seen in 2008, and the wizardry to re-inflate a stock market bubble this year. Beijing is following the Greenspan – Bernanke blueprints, - turning to massive money printing to re-inflate bubbles in asset markets, in order to jump start an economy from the doldrums, or in this latest case, from the grip of the Great Recession.

A relatively healthy banking system enabled the Chinese central bank to work its magic. China’s M2 money supply is growing at a record +28.5% annualized rate, and the money supply surge is coinciding with big rallies in stocks and property, spilling over into neighboring Hong Kong. State-controlled Chinese banks extended 7.4-trillion yuan ($1.2-trillion) of new loans in the first half of this year, equal to 25% of China’s entire economy - helping to fuel a powerful Shanghai red-chip rally.
One of the beneficiaries of the explosive growth of the Chinese money supply is the Shanghai gold market, which is trading near 6,600-yuan /ounce, and is also tracking powerful rallies in industrial commodities. China is poised overtake India as the world’s top gold consumer this year, and there is speculation that Beijing will quietly buy the gold which the IMF wants to sell in the years ahead.
China, the world’s biggest gold mining nation, is seeking to boost gold output by 3% to 290-tons this year, far less than the 400-tons it consumed last year. Thus, China could become an even bigger importer of the yellow metal in the months ahead, helping to cushion inevitable corrections in the gold market. Given the trade-off between expanding growth and fighting asset-price inflation, Shanghai traders are betting that Beijing will opt to blow even bigger bubbles in asset markets.
Industrial Commodities Eyeing Shanghai,
China’s super-easy monetary policy is designed to offset the damage to its export-dependent regions, which are suffering from the collapse in global trade. Beijing is also spending 4-trillion yuan on infrastructure projects, equal to roughly 15% of its economic output per year, to create jobs and stoke economic growth. So it was of great interest to global traders, when the Shanghai red-chips suddenly plunged -5% on July 29th, the biggest daily loss in eight-months, on rumors that Beijing would curb bank lending in the second half of this year.
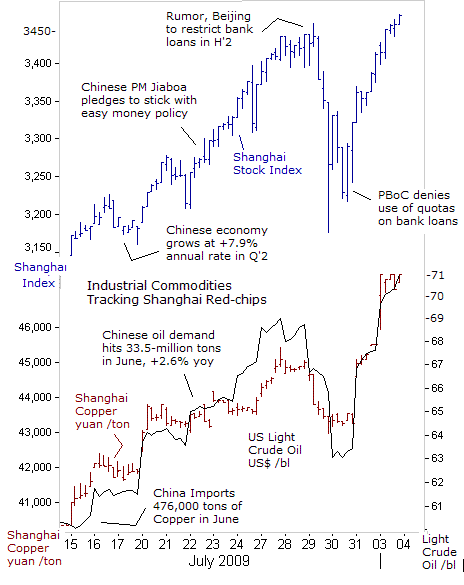
The Shanghai index is prone to sudden shake-outs, with the index trading at 35-times earnings, and Shenzhen’s small-cap shares trading at 45-times earnings. The Shanghai red-chip index has evolved into the locomotive for key industrial commodities, such as crude oil, base metals, and rubber. Industrial commodities rebounded from a nasty one-day shake-out on July 29th, after the People’s Bank of China wasted little time, in denying rumors swirling in the media that is was considering the idea of enforcing quotas on bank loans.
The prospects for Chinese corporate earnings growth are of critical importance, with the Shanghai stock index flying higher in bubble territory. Large-scale industrial companies in 22 Chinese provinces saw their profits decline -21.2% in the first half to 894.14 billion yuan, but the decline rate was less from the first quarter’s 32% slide, and nowadays, “less bad,” means signs of recovery.
The most optimistic scenario calls for Chinese industrial profits to rebound to an annualized growth rate of +30% in the fourth quarter, due to the government’s massive stimulus. China’s Bank of Communications predicts the economy’s growth rate will to accelerate to a pace of +9% in the third-quarter and +9.8% in the fourth-quarter. China’s crude steel output would surely top 500-million tons this year, equaling 40% of the world’s total production.
Korea Joins Alignment of B-R-I-C-K
Upbeat markets in China are helping underpin the BRIC nations, including Brazil, India, and Russia, which have the four best performing stock markets this year. Brazil’s Bovespa Index is up 79%, India’s Sensex Index is up 63%, and Russia’s RTS Index has gained 62-percent. The S&P-500 Index by comparison, is up 9.4% this year, while Japan’s Nikkei-225 index is up 7.5-percent.
One could add Korea to the alignment of B-R-I-C-K stars, since the Kospi Index has rebounded by 72% above its November low, emerging as the most favored market among global investors. With growing appetites for risky assets, global investors have rushed to snatch up Korean Kospi shares, particularly those in the information technology (IT) and the auto sectors. Foreigners were net buyers of $4.7 of Korean stocks in July, much larger than net-purchases of $2.6-billion of stocks in Taiwan, $1.9-billion shares in India, and $1.29 billion shares in South Africa.
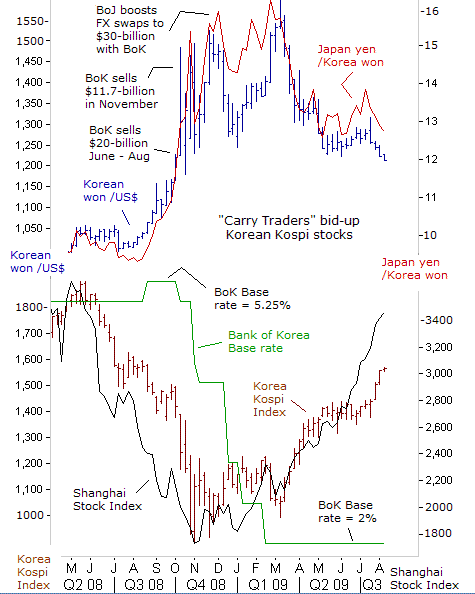
“Money has no motherland, financiers are without patriotism and without decency, - their sole object is gain,” observed Napoleon Bonaparte. Highlighting the fickle nature of speculators, - foreigners bought a record $18-billion of Korean securities in the second-quarter of this year, or 24-times more than $750 million the previous quarter. In the third and fourth quarters of 2008, foreigners sold $17.9-billion and $17.4-billion, respectively, at the height of the global financial turmoil.
Foreign buying of Korean equities knocked the US-dollar 28% lower against the Korean-won, and the Japanese yen has tumbled 20% to 12.8-won, since March 10th, when global stock markets bottomed out. “Carry traders” are active in Seoul, and profiting from a stronger won. In a world where G-7 central banks are pegging rates at record low levels, it does not take much imagination to envision the Federal Reserve, the ECB, and the Bank of Japan underwriting rallies in the emerging currencies of Brazil, Russia, India, and Korea, just as Tokyo pumped massive liquidity straight into New Zealand and Australian dollars during its flirtation with the hallucinogenic drug - “Quantitative Easing” (QE) between 2001 and 2006.
Virtuous Cycle Swings in the Kremlin’s favor,
The resilience of China’s economy has rekindled the de-coupling debate, which hinges on the premise that the emerging economies in Brazil, Russia, India, China, (BRIC) can grow in spite of a declining G-7 economies. The so-called BRIC countries accounted for half of global growth in 2008 - China alone accounted for a quarter, and Brazil, India, and Russia combined equaled another quarter. Furthermore, the IMF notes that BRIC “accounted for more than 90% of the rise in consumption of energy products and metals, and 80% of grains since 2002.”
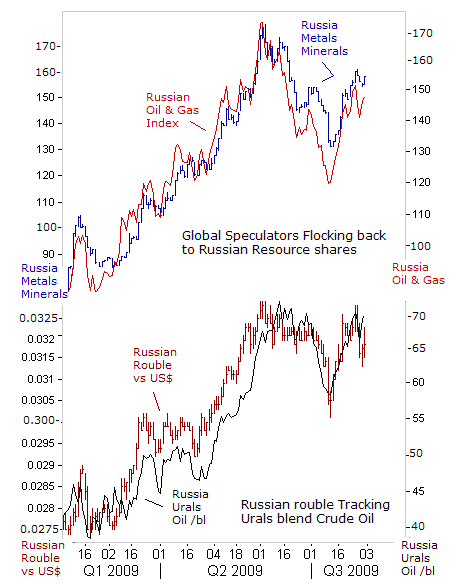
The virtuous cycle of events are now swinging back in the Kremlin’s favor, as global speculators flock back into hard-hit resource shares trading in Moscow. Russia’s central bank cut its main interest rates for the fourth time in less than three-months, after Moscow said the local economy contracted an annual 10.2% in the January-May period. Bank Rossii lowered the refinancing rate a half-point to 11% following on initial reduction on April 24th and two further cuts on May 13th and June 5th.
The Russian rouble has rebounded 16% against the US-dollar, since the first quarter, as Urals blend crude oil rebounded towards $70 a barrel, and base metals surged higher, boosting demand for Russia’s currency, a world leader in commodity exports. Russia is the world’s second-largest oil exporter behind Saudi Arabia, and supplies a quarter of Europe’s natural gas needs. Russia is also the world’s largest nickel and palladium miner, the second largest platinum miner, and the fourth-largest iron ore miner, behind Brazil, Australia, and India.
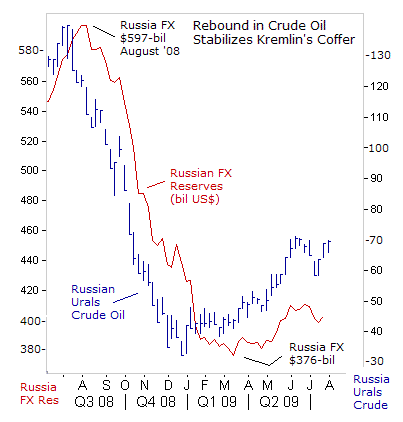
After reaching a record high of $597-billion last August, Moscow’s foreign currency reserves were dramatically depleted in the second-half of 2008, as the central bank spent more than $200-billion supporting the Russian rouble and bolstering the capital position of domestic banks. This year’s rebound in Urals blend crude oil has improved the Kremlin’s coffers, to the tune of $404-billion today. China, the world’s second-largest oil guzzler, imported 3.83-million barrels per day in July, or 25% more than a year earlier, the fastest pace in nearly two-years.
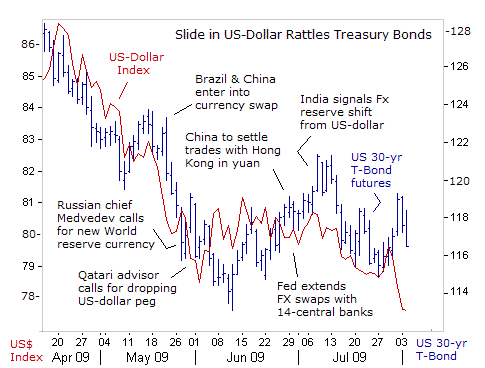
The BRIC nations are rethinking how their US-dollar currency reserves are managed, underlining a power shift from the United States, which spawned the global financial crisis. Russian chief Dmitry Medvedev has repeatedly questioned the US-dollar’s future as a global reserve currency. China is allowing companies in its southern provinces of Yunnan and Guangxi to use yuan to settle cross-border trade with Hong Kong and Southeast Asia to reduce exposure to the US-dollar.
India Weathers the “Great Recession”
Reserve Bank of India chief Duvvuri Subbarao says India’s modest dependence on exports will help Asia’s third largest economy, to weather the “Great Recession” and even stage a modest recovery later this year. Even during the depths of the October massacre in the Bombay Sensex Index, India managed to maintain a 5.3% growth rate in the fourth quarter, and India’s banking system had virtually no exposure to any kind of toxic asset, manufactured in the United States.
India’s factory output contracted by a slim 0.25% in January, the first decline this decade, and export earnings had fallen for six straight months. In January exports were 16% lower from a year earlier tumbling to $12.3-billion. So the Reserve Bank of India (RBI) scrambled to rescue the Bombay stock market, by slashing its lending rates six times from September thru April, by a total of 425-basis points.
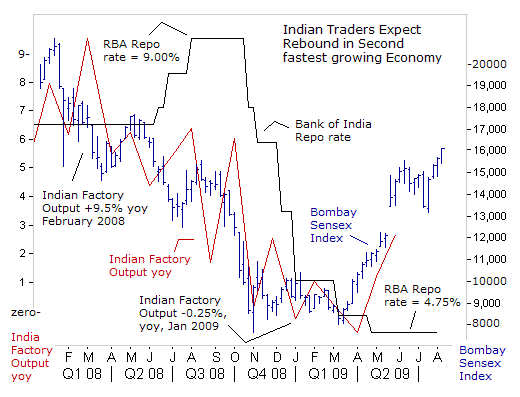
The Indian Sensex index began to decouple from Wall Street and Tokyo in early May, after it rallied 14% for its biggest weekly gain since 1992, when Indian Prime Minister Manmohan Singh won a second term. Bombay stocks soared with enthusiasm at the prospect that Singh’s new government, shorn of Communists, would privatize up to $20-billion of state-owned assets, increase foreign investment in highly profitable crown jewel companies, begin deregulation of banking and financial services, and gut restrictions on the closing of factories.
India’s factory sector, measured by the Purchasing Mgr’s Index, held strongly at a reading of 55.3 in July, or 2-points higher than China’s, signaling a strong industrial recovery in the second half of this year. If the decoupling of China, India, Russia, and Brazil becomes a reality, it could be good for the developed G-7 nations, as growing wealth in BRIC nations could, in theory, increase demand for goods made in battered nations like Japan, Germany, and the United States.
A decoupling between the emerging BRICK nations and the more developed G-7 economies would mean a huge shift in the global financial markets, away from the traditional pattern of emerging markets dancing to the tune of G-7 economies, which still account for 60% of global GDP. Instead, increasing independence could lead to a greater sphere of influence of the emerging giants, led by Beijing.
In the United States, Fed chief Bernanke is pumping a “bailout bubble” for Wall Street, similar to the policies of his mentor “Easy” Al Greenspan, who inflated the housing bubble, the sub-prime debt bubble, and the high-tech bubble. It’s a never ending cycle of boom-and-busts of bubbles, engineered by central banks. The revival of the “Commodity Super Cycle,” might already be already in motion, and if a global economic recovery gains traction, soaring input costs, would begin to crimp the profit margins of the giant Asian industrialists.
All the liquidity that’s been unleashed into the global banking system would play havoc with accelerating inflation. History shows that central banks won’t pre-empt inflation by withdrawing liquidity early. Instead, the money printers tend to inflate bubbles to dangerous proportions. Add to the mix, the vast leverage of the US-dollar and Japanese yen carry trades, it’s going to be a wild ride for the US Treasury bond market, which is increasingly dependent upon the whims of BRICK.
This article is just the Tip-of-the-Iceberg of what’s available in the Global Money Trends newsletter, for insightful analysis and predictions of the future direction of (1) top stock markets around the world, (2) Commodities such as crude oil, copper, gold, silver, steel, and soybeans (3) Foreign currencies, including exotics, (4) Libor interest rates and global bond markets (5) Central banker "Jawboning" and Intervention techniques that move markets.
By Gary Dorsch,
Editor, Global Money Trends newsletter
http://www.sirchartsalot.com
GMT filters important news and information into (1) bullet-point, easy to understand analysis, (2) featuring "Inter-Market Technical Analysis" that visually displays the dynamic inter-relationships between foreign currencies, commodities, interest rates and the stock markets from a dozen key countries around the world. Also included are (3) charts of key economic statistics of foreign countries that move markets.
Subscribers can also listen to bi-weekly Audio Broadcasts, with the latest news on global markets, and view our updated model portfolio 2008. To order a subscription to Global Money Trends, click on the hyperlink below, http://www.sirchartsalot.com/newsletters.php or call toll free to order, Sunday thru Thursday, 8 am to 9 pm EST, and on Friday 8 am to 5 pm, at 866-553-1007. Outside the call 561-367-1007.
Mr Dorsch worked on the trading floor of the Chicago Mercantile Exchange for nine years as the chief Financial Futures Analyst for three clearing firms, Oppenheimer Rouse Futures Inc, GH Miller and Company, and a commodity fund at the LNS Financial Group.
As a transactional broker for Charles Schwab's Global Investment Services department, Mr Dorsch handled thousands of customer trades in 45 stock exchanges around the world, including Australia, Canada, Japan, Hong Kong, the Euro zone, London, Toronto, South Africa, Mexico, and New Zealand, and Canadian oil trusts, ADR's and Exchange Traded Funds.
He wrote a weekly newsletter from 2000 thru September 2005 called, "Foreign Currency Trends" for Charles Schwab's Global Investment department, featuring inter-market technical analysis, to understand the dynamic inter-relationships between the foreign exchange, global bond and stock markets, and key industrial commodities.
Copyright © 2005-2009 SirChartsAlot, Inc. All rights reserved.
Disclaimer: SirChartsAlot.com's analysis and insights are based upon data gathered by it from various sources believed to be reliable, complete and accurate. However, no guarantee is made by SirChartsAlot.com as to the reliability, completeness and accuracy of the data so analyzed. SirChartsAlot.com is in the business of gathering information, analyzing it and disseminating the analysis for informational and educational purposes only. SirChartsAlot.com attempts to analyze trends, not make recommendations. All statements and expressions are the opinion of SirChartsAlot.com and are not meant to be investment advice or solicitation or recommendation to establish market positions. Our opinions are subject to change without notice. SirChartsAlot.com strongly advises readers to conduct thorough research relevant to decisions and verify facts from various independent sources.
Gary Dorsch Archive |
© 2005-2022 http://www.MarketOracle.co.uk - The Market Oracle is a FREE Daily Financial Markets Analysis & Forecasting online publication.


