Precious Metals, Gold and Silver are Ready to Shine
Commodities / Gold & Silver 2009 Aug 03, 2009 - 01:44 PM GMT In the previous essay I mentioned that a brief consolidation is in the cards and is likely to take place immediately, or after additional few more days of rising gold, silver and PM stock prices, and a small dip in the USD Index. I stated that:
(…) if mining stocks break down from the triangle pattern, the following move should be rather insignificant - I don't think that it would take the GDX ETF below 37 level.
This week GDX ETF (proxy for PM stocks) moved to 37.02 and bounced sharply. The move to the 37 level that materialized on Tuesday and Wednesday was rather rapid and took place on relatively high volume, which means that many investors were shaken off the golden/silver bull. I doubt that these investors were nimble enough to get back in at the exact bottom, and are now wishing they had kept their positions intact. Fortunately, those who follow my analysis, knew about the coming correction ahead of many other market participants, and were prepared for this scenario.
Moving on to this week’s precious metals markets, let’s begin with gold (charts courtesy of http://stockcharts.com).
Gold

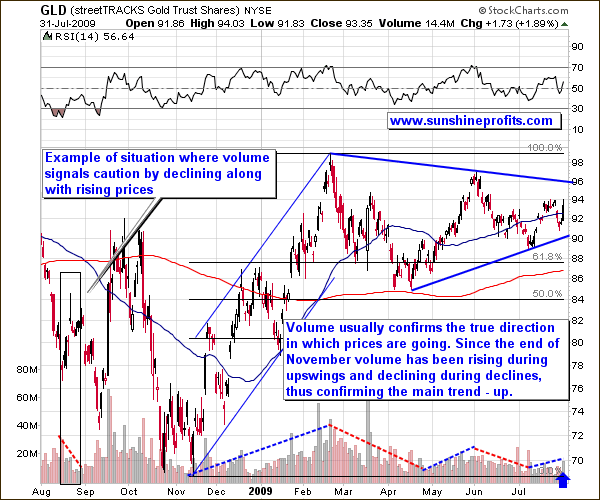
I would like to begin with a yearly chart in order to put things into perspective. The year 2008 saw disastrous nose-dives in many markets as hedge fund managers were forced to liquidate positions to raise cash. Consequently, many markets were hit that normally would have been expected to hold up well, including the gold market generally known as a safe haven during times of economic turbulence. As time passed, however, investors picked up investments with the best fundamental situations and prices resumed their previous trend. This is what happened with gold.
Although the situation for gold and other PM markets is favorable fundamentally and now, also technically, there are voices that doubt the existence of the PM bull market and wait for it to plunge once again. My interpretation of gold charts, the fundamental situation and recent news, tells me that higher prices, not lower, are in store in the coming months.
Silver

Last week I wrote:
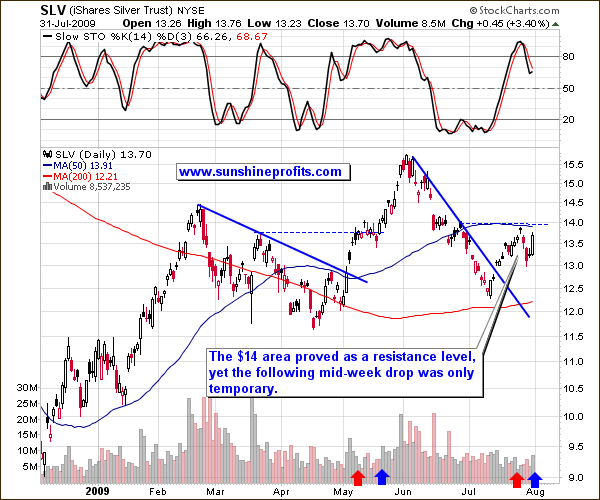
During a similar breakout in May, silver has consolidated around the price level corresponding to the previous local top - the $13 - $14 area. The analogical price level today is several cents higher - around $14.
The small consolidation, which I mentioned further in the essay, took place this week, and now, technically speaking, silver is in a much more favorable juncture. The momentum traders have been shaken out of the market by this week’s correction and new buying power emerged. Momentum traders will be back once we move higher, adding more fuel to the rally. On the above chart we see this as a small consolidation. Many indicators react to such a consolidation by going out of the overbought territory, as you can see in the featured Stochastic Indicator.
Please note that when prices rose on a strong volume, a rally followed (marked with blue arrow), but when the same took place on relatively low volume, we have seen lower prices of silver (red arrows). Therefore, high volume during Friday’s upswing suggests that this day has most likely marked a beginning of a new rally.
Precious Metals Stocks

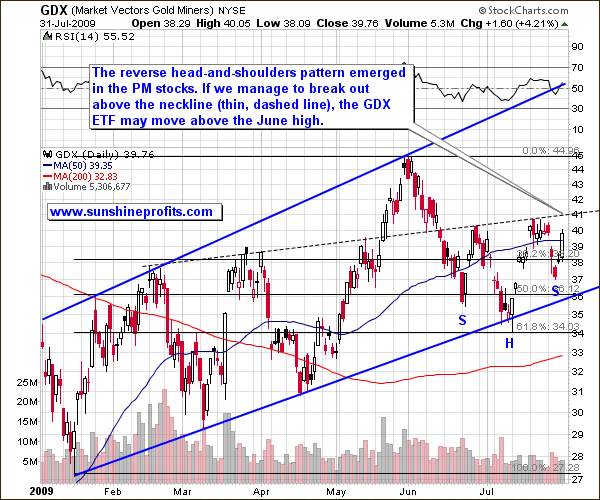
Precious metals stocks have also corrected the full 61.8% Fibonacci retracement level – to $34. Again, this signals that the correction is indeed complete.
Volume has been declining in the mining stocks since the beginning of June, but it is nothing to worry about, taking into account the reverse head-and-shoulders formation that has just emerged in the sector. In this formation, the volume declines as the formation is being shaped, until the price breaks out, at which time we want to see high volume as additional confirmation.
The particularly interesting feature to notice in the head-and-shoulders pattern is that it provides clear guidelines to the minimum range of the move likely to follow a confirmed breakout. The size of the rally should amount at least the “height” of the head. Here, taking the conservative approach towards rounding, it equals $40.5 – $35 = $5.5. After calculating this number we can add it to the neckline level, which is where the breakout would take place. Here it’s about the 41 level, so if we successfully break out of the pattern, the GDX ETF is likely to go to at least $46.5.
One thing that might concern us right now is the general stock market’s overbought condition, which makes a plunge rather likely.
Correlations

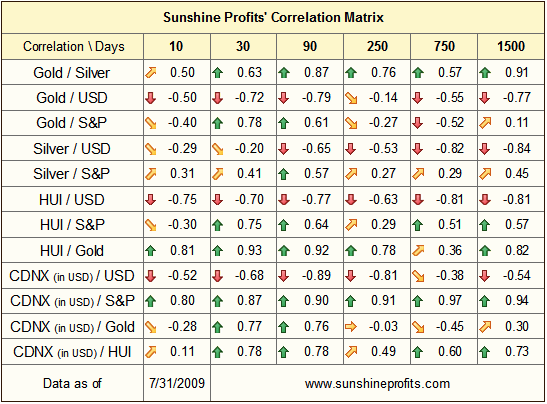
Previously, the USD Index has moved in tune with the general stock market and the precious metals market, which resulted in very strong correlation coefficients. This week, however, the situation has changed. During the last two weeks the correlation between the S&P 500 and the gold sector (gold, mining stocks) decreased significantly. The change has been less visible in the case of silver, as the white metal is generally more closely correlated with most stocks.
It’s important to notice that in the case of gold and gold stocks, the correlation turned from positive to negative. In essence, during the past two weeks, gold and PM equities have moved in the opposite direction to the main stock indices. I would not go so far as to say that a bearish situation in the general stock market would be positive for the PM sector in the short term, but the numbers are telling us that a possible downturn in most stocks will not necessarily mean the same for gold. From a purely statistical point of view, the 10-trading-day column is not significant. However, the change here is big enough to soon also make a difference in the 30-trading-day column. We will wait and see.
Summary
This week we have seen precious metals dip sharply, but briefly. Since the precious metals sector has moved higher rather rapidly in the middle of the previous month, such a correction is a healthy development and increases the probability of further gains. The existence of the bull market in gold is confirmed by the appropriate action in volume.
As far as short term is concerned, we have just seen strength in PMs and in corresponding equities along with high volume, which indicates that more gains are likely in the not-too-distant future. Additionally, mining stocks appear to have formed a reverse head-and-shoulders pattern, which also has bullish implications.
To make sure that you get immediate access to my thoughts on the market, including information not available publicly, I urge you to sign up for my free e-mail list Sign up today and you'll also get free, 7-day access to the Premium Sections on my website, including valuable tools and charts dedicated to serious PM Investors and Speculators. It's free and you may unsubscribe at any time. Additionally, if you considered subscribing to the Premium Service in the past, but didn’t want to use monthly subscription type, we have good news for you – we have just introduced 90-day and yearly subscriptions, which are available at a discount.
P. Radomski
Editor
Sunshine Profits
Interested in increasing your profits in the PM sector? Want to know which stocks to buy? Would you like to improve your risk/reward ratio?
Sunshine Profits provides professional support for precious metals Investors and Traders.
Apart from weekly Premium Updates and quick Market Alerts, members of the Sunshine Profits’ Premium Service gain access to Charts, Tools and Key Principles sections. Click the following link to find out how many benefits this means to you. Naturally, you may browse the sample version and easily sing-up for a free trial to see if the Premium Service meets your expectations.
All essays, research and information found above represent analyses and opinions of Mr. Radomski and Sunshine Profits' associates only. As such, it may prove wrong and be a subject to change without notice. Opinions and analyses were based on data available to authors of respective essays at the time of writing. Although the information provided above is based on careful research and sources that are believed to be accurate, Mr. Radomski and his associates do not guarantee the accuracy or thoroughness of the data or information reported. The opinions published above belong to Mr. Radomski or respective associates and are neither an offer nor a recommendation to purchase or sell securities. Mr. Radomski is not a Registered Securities Advisor. Mr. Radomski does not recommend services, products, business or investment in any company mentioned in any of his essays or reports. Materials published above have been prepared for your private use and their sole purpose is to educate readers about various investments.
By reading Mr. Radomski's essays or reports you fully agree that he will not be held responsible or liable for any decisions you make regarding any information provided in these essays or reports. Investing, trading and speculation in any financial markets may involve high risk of loss. We strongly advise that you consult a certified investment advisor and we encourage you to do your own research before making any investment decision. Mr. Radomski, Sunshine Profits' employees and affiliates as well as members of their families may have a short or long position in any securities, including those mentioned in any of the reports or essays, and may make additional purchases and/or sales of those securities without notice.
Przemyslaw RadomskiArchive |
© 2005-2022 http://www.MarketOracle.co.uk - The Market Oracle is a FREE Daily Financial Markets Analysis & Forecasting online publication.


