Financial Stocks ETF XLF Needs to Break Its Down Trendline
Stock-Markets / Banking Stocks Jul 31, 2009 - 03:46 PM GMTBy: Mike_Paulenoff
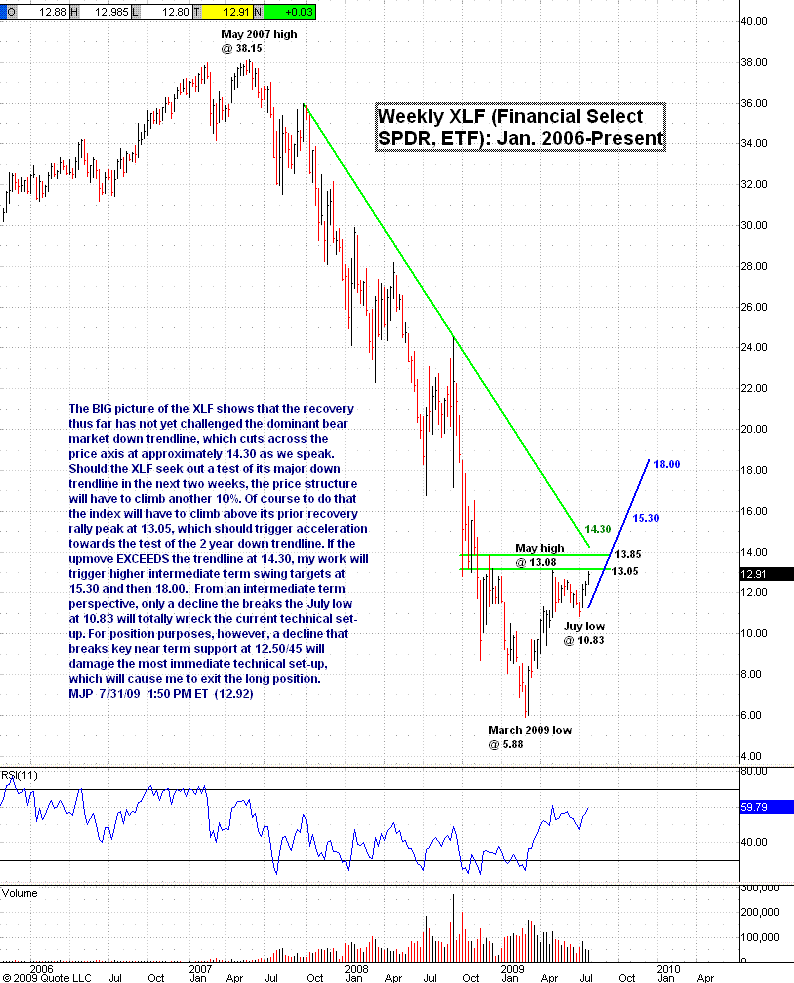
 The big picture of the Financial Select Sector ETF (XLF) shows that the
recovery
thus far has not yet challenged the dominant bear market down trendline,
which cuts across the
price axis at approximately 14.30 as we speak. Should the XLF seek out a
test of its major down
trendline in the next two weeks, the price structure will have to climb
another 10%. Of course, to do that
the index will have to climb above its prior recovery rally peak at 13.05,
which should trigger acceleration
towards the test of the 2 year down trendline. If the upmove exceeds the
trendline at 14.30, my work will
trigger higher intermediate term swing targets at 15.30 and then 18.00.
From an intermediate term perspective, only a decline the breaks the July low at 10.83 will totally wreck the current technical set-up. For position purposes, however, a decline that breaks key near term support at 12.50/45 will damage the most immediate technical set-up, which will cause me to exit our model portfolio long position.

Sign up for a free 15-day trial to Mike's ETF Trading Diary today.
By Mike Paulenoff
Mike Paulenoff is author of the MPTrader.com (www.mptrader.com) , a real-time diary of Mike Paulenoff's trading ideas and technical chart analysis of
Exchange Traded Funds (ETFs) that track equity indices, metals, energy commodities, currencies, Treasuries, and other markets. It is for traders with a 3-30 day time horizon, who use the service for guidance on both specific trades as well as general market direction
© 2002-2009 MPTrader.com, an AdviceTrade publication. All rights reserved. Any publication, distribution, retransmission or reproduction of information or data contained on this Web site without written consent from MPTrader is prohibited. See our disclaimer.
Mike Paulenoff Archive |
© 2005-2022 http://www.MarketOracle.co.uk - The Market Oracle is a FREE Daily Financial Markets Analysis & Forecasting online publication.


