Economic Crisis Not Over but Stock Market Rally Can Last A Few More Quarters
Stock-Markets / Stock Index Trading Jul 29, 2009 - 06:39 AM GMT Claus Vogt writes: You might be familiar with this common example of probability theory: The exercise of drawing colored marbles from a container.
Half of the marbles are white, the other half are black. You remove one marble, write down the color, and put the marble back in the container. Then repeat the process, again and again.
In the short run you may experience streaks of drawing one black marble after another. It might happen three times in a row, five times in a row, even ten times in a row.
However, these short-term results do not change your long-term outcome — the fact that you’ll draw black marbles half of the time and white marbles half of the time.
When investing, this same law holds true. Some decisions will turn out to be losers. In the long run, though, you’ll earn money if your methodology has an edge.
Let me explain …
A Disciplined Approach Is My Edge …
 |
| Is Buffett just a lucky guy, or does he hold an edge when investing? |
The “random walk” approach to markets supposes that 50 percent of the marbles in the bucket are white and 50 percent are black. Accordingly, nobody can achieve more than the market’s average performance, and Warren Buffett was just an incredibly lucky guy.
I don’t think that premise is true. And I believe that Buffett’s long-term success proves this point.
In my opinion, the world of investing does not always deal with 50:50 chances … sometimes there are buckets with more black marbles than white ones by a wide margin and vice versa.
My indicators are geared to inform me when this is the case. And they tell me when the buckets hold special opportunities or unexpected risks.
I may still encounter a streak of losers in the short run. But in the long run, I’ll make money because my winners will outweigh my losers by sticking to my disciplined approach.
How My Approach Works …
 |
| When there are more white marbles than black ones, I run with the bulls. |
If black marbles represent falling stock prices and white marbles represent rising prices, it becomes clear what to do: Whenever black marbles are a majority I implement a bearish strategy; whenever white marbles dominate I run with the bulls.
For example, when the yield curve is inverted, and the year-over-year percent change in the Index of Leading Economic Indicators (LEI) is negative three months in a row, chances are extremely high that a recession will follow soon.
In this case let’s say, that 90 percent of the marbles in the bucket are black. Whenever this rare condition is given I’ll get out of stocks and buy inverse ETFs and long-term Treasury bonds. The last time this condition prevailed was in 2007.
Technical analysis is just one part of my approach. Longer term, fundamentals and macroeconomics are the financial markets’ driving forces. But markets can stay irrational much longer than you might think. That’s why it pays to take technical analysis seriously … at least when compelling signals are generated.
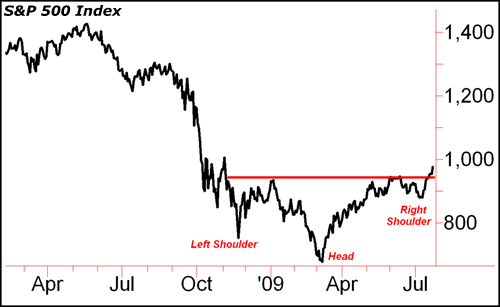
And that’s precisely the case right now. Take a look at the chart below …

Source: Tradestation
Last Thursday, the S&P 500 index rose above its June high. In doing so, it’s showing an important bottoming formation: A huge head and shoulders bottom. Rising volume and strong market breadth confirmed the buy signal. Additional proof came from foreign markets showing more or less the same bullish pattern. And from the 200-day moving averages, which are in the process of turning around as well.
I take these signals seriously. They’re telling me to expect a continuation of the bear market rally off of the March lows.
I deem it probable now that this rally will have legs. And I expect the markets to keep rising and not come under serious pressure again until the second quarter of 2010.
I use the LEI to back up this view. It moved up from minus 4.0 percent year-over-year in May to minus 1.2 percent in June. This clear improvement points to some kind of an economic rebound.
No, the crisis is not yet over. Longer-term fundamentals are strongly against a more optimistic outcome. But a few quarters of a shallow economic recovery, caused by the huge stimulus programs all over the world, is the most probable outcome now.
In other words, all my indicators are telling me the jar now has more white marbles in it than it did just a month ago.
Best wishes,
Claus
This investment news is brought to you by Money and Markets . Money and Markets is a free daily investment newsletter from Martin D. Weiss and Weiss Research analysts offering the latest investing news and financial insights for the stock market, including tips and advice on investing in gold, energy and oil. Dr. Weiss is a leader in the fields of investing, interest rates, financial safety and economic forecasting. To view archives or subscribe, visit http://www.moneyandmarkets.com .
Money and Markets Archive |
© 2005-2022 http://www.MarketOracle.co.uk - The Market Oracle is a FREE Daily Financial Markets Analysis & Forecasting online publication.


