Gold Market Update - Potential Double Top for Gold
Commodities / Gold & Silver Jun 11, 2007 - 12:01 AM GMTBy: Clive_Maund
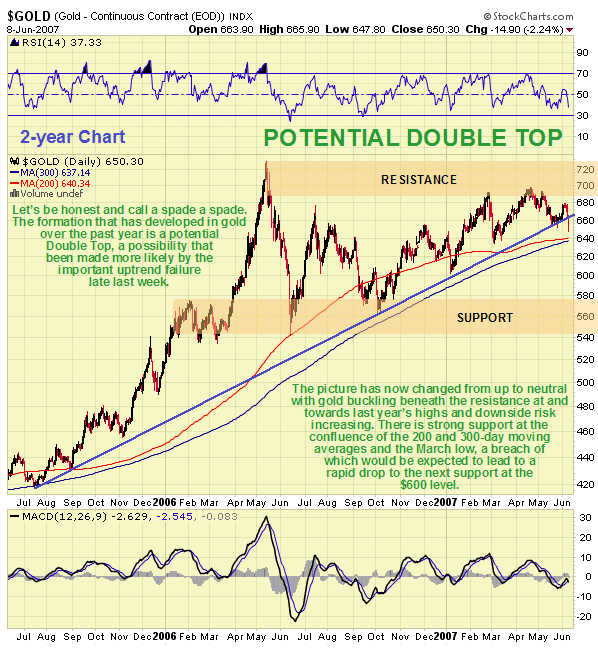
 This Gold Market update makes grim reading - if you believe it that is. Gold had been weakening and rounding over since its late February high, and on Thursday and Friday it dropped sharply, breaking below its uptrend in force for nearly 2 years, from July 2005, for the 1st time, after deceptively rising away from it.
On the 2-year chart we can clearly see that we are at a critical juncture, for having broken below the trendline, gold is now only a little above its 200 and 300-day moving averages, which are themselves very close together. Throughout its bull market gold has always found support at or above its 300-day moving average, always turning up above or at this average, the only exception being one occasion in 2004 when it dropped a little below it.

It had been remarked on in past Gold Market updates that the entire formation from last year’s highs at around $730 was a potential Double Top in the making, and last week’s break below the long-term trendline has considerably increased the risk that this is the case. At this juncture it is worth noting that gold appears to be completing a Double Top against various other important currencies including the Australian dollar, the Canadian dollar, the Euro, the British Pound, with the one against the Canadian dollar being a particularly fine example. Only against the Japanese Yen has gold made any significant progress since last year. If this is happening, and it is, then what is the principal reason for it - fortunately we don’t have to look far to find the answer.
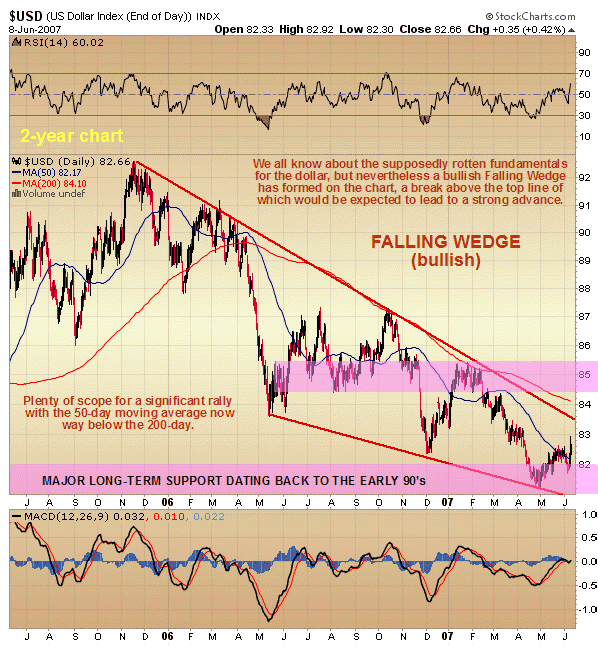
After earlier looking like it was turning lower again, the US dollar made sharp gains late last week, which is why gold got clobbered, but the bigger picture revealed by the US dollar index charts really piles on the agony for gold bugs - for the dollar appears to be turning up, BIG TIME.

On the 2-year US dollar index chart we can see that, taking into account the late April - early May lows, the dollar has marked out a bullish Falling Wedge pattern, taking the late 2005 highs as the starting point for drawing our trendlines, and the chances are high that this downtrend terminated with the late April - early May lows which were on strong support that dates way back to the early 90’s. Around the time of these lows there was a lot of talk going around about the dire consequences of their failure, but the chances of them failing was and is slim, no matter how bad the fundamentals may look, because of their historic significance. The appearance of this Falling Wedge right above a major support zone is a very bullish sign for the dollar, and the more strongly the lines of the wedge converge, the more bullish it is, and here they are converging quite strongly.

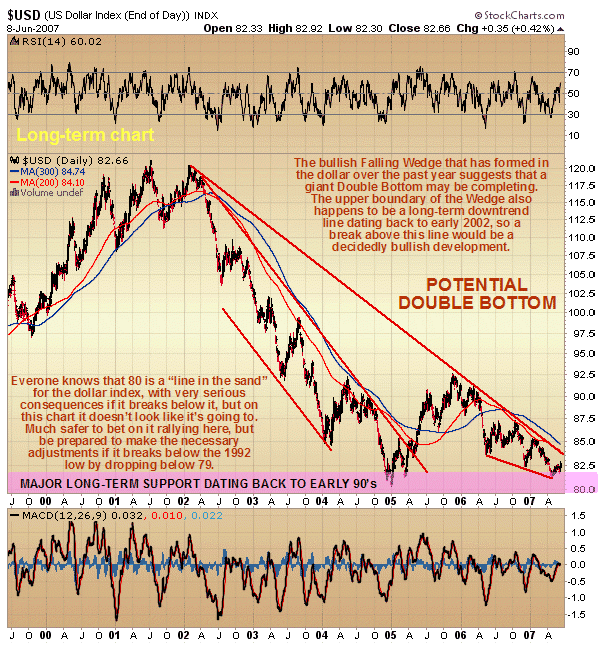
If we project the upper trendline of the wedge backwards in time on the long-term dollar chart we can see that it arrives at exactly at the early 2002 high, the kind of synchronicity you often see in Technical Analysis, and which will give an upside breakout above this line added significance. On this long-term chart we can further see how the Falling Wedge of recent months comprises that right side of a large Double Bottom formation above major support that mirrors the Double top completing in gold.
If these formations complete as they look like they are going to then clearly it will be wise to take appropriate action before the event rather than after. Some older readers might remember Joseph Granville’s old refrain “Sell all stocks” which, while crude and simplistic, was often the most effective course of action because when a sector or the market as a whole falls heavily, the good frequently gets tossed overboard with the bad. Over the past year we have generally avoided investing in the larger PM stocks, which has made sense as the sector overall has gone nowhere, as can be seen by glancing at the HUI or XAU index charts, which are both looking toppy. We have instead concentrated on smaller issues and have made good gains in many stocks, often in a very short period of time.
We are currently long a wide range of these issues and it is thought wise at this time to go through portfolios and prune them, locking in profits in overbought issues and otherwise selling stocks that look vulnerable to an accelerating sector downturn, which might be aggravated by a broad market retreat that is looking increasingly likely. While smaller stocks can move almost completely independently of the sector indices as a result of favorable drilling results etc, the stocks of many good companies often suffer severe losses due to attrition - continuous light selling in the absence of buying interest - in adverse market conditions, as we saw following the sector peak last year. We will be reviewing a wide range of individual stocks recommended on the site over the past 6 months or so in a Market Notebook update shortly. A “hammer candlestick” appeared on the Precious Metals stock indices on Friday, signaling a probable short-term bottom - so we are likely to see some respite and a bounce early next week which should afford a window of opportunity to adjust positions.
By Clive Maund
CliveMaund.com
© 2007 Clive Maund - The above represents the opinion and analysis of Mr. Maund, based on data available to him, at the time of writing. Mr. Maunds opinions are his own, and are not a recommendation or an offer to buy or sell securities. No responsibility can be accepted for losses that may result as a consequence of trading on the basis of this analysis.
Mr. Maund is an independent analyst who receives no compensation of any kind from any groups, individuals or corporations mentioned in his reports. As trading and investing in any financial markets may involve serious risk of loss, Mr. Maund recommends that you consult with a qualified investment advisor, one licensed by appropriate regulatory agencies in your legal jurisdiction and do your own due diligence and research when making any kind of a transaction with financial ramifications.
© 2005-2022 http://www.MarketOracle.co.uk - The Market Oracle is a FREE Daily Financial Markets Analysis & Forecasting online publication.


