U.S. Dollar Stabilization and the Stock / Gold Ratio
Stock-Markets / Financial Markets 2009 Jul 28, 2009 - 11:17 AM GMTBy: Ashraf_Laidi
 Dollar weakness has been excessive...at least for now..
The overnight wave of dollar selling was mostly led by a fresh wave of buying in commodity currencies (rather than only rising equities) courtesy of +$70 in crude prices and hawkish comments from the Reserve Bank of Australia raising the possibility of rate hikes before a peak in the unemployment rate. Markets were already expecting the RBA to raise rates by 25 bps by year-end.
Todays comments further boost the long term viability of the currency. But current US dollar weakness shows to have grown unsustainable considering the related expansion in risk appetite and the lack of unjustifiable data developments in the Eurozone, UK, Canada and New Zealand--and not to mention recent rhetoric from central bankers and finance Ministry officials to jawbone the latest strength in their currencies. Accordingly, we cannot ignore the flattening momentum in G-5 equities over the last 3 sessions, which is beginning to appear similar to the period prevailing in the first week of June.
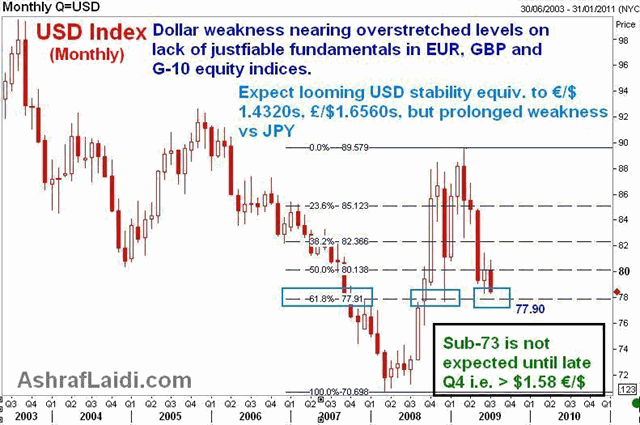
The Dollar Index (basket against 6 currencies with EUR accounting for 57% of the basket) has tested the June lows at 78.31, a break of which would be the lowest since December. We should once again expect to hold at 78.25 -- the 61.8% retracement of the rise from the 71.29 low to the 89.50 high. The fact that dollar weakness occurred despite a flat Tuesday close in the Nikkei underlines the prevalence of the sell-USD status quo, which was magnified earlier by hawkish comments from the RBA. But its time for a corrective bounce again.

Current price action suggesting unsustainability of further USD weakness reflected in the lack of follow-through in EURUSD, and GBPUSD, as market remains unwilling to close at its intraday highs (trend of past 7 sessions). Throughout last week, we addressed the failure by these currencies to close at or near their intraday highs, a recurring trend that began to suggest unsustainability in these rallies.
Thus, the equivalent of the 77.90 support in the dollar index translates roughly to $1.4320 in EURUSD resistance, $1.6570 in GBPUSD resistance, 0.8360-70 in AUDUSD and 0.6650 in NZDUSD, all of which are expected to hold into first week of August. Prior to this morning's US data release we asked in our Intraday Market Thoughts (08:30 ET) "If equities hardly managed a rebound despite a sharp increase in US new home sales, then what would they do in case of renewed decline in S&P/Case Shiller home price index and US July consumer confidence". Indeed, consumer confidence slumped to 46.6 in July, even at a time of rallying equities. We remind that the June 30th release of the June consumer confidence coincided with the intermediate peak in equity indices before a 6% decline occurred in the ensuing 2 weeks.
How Much Beyond Parity in S&P500/Gold Ratio?
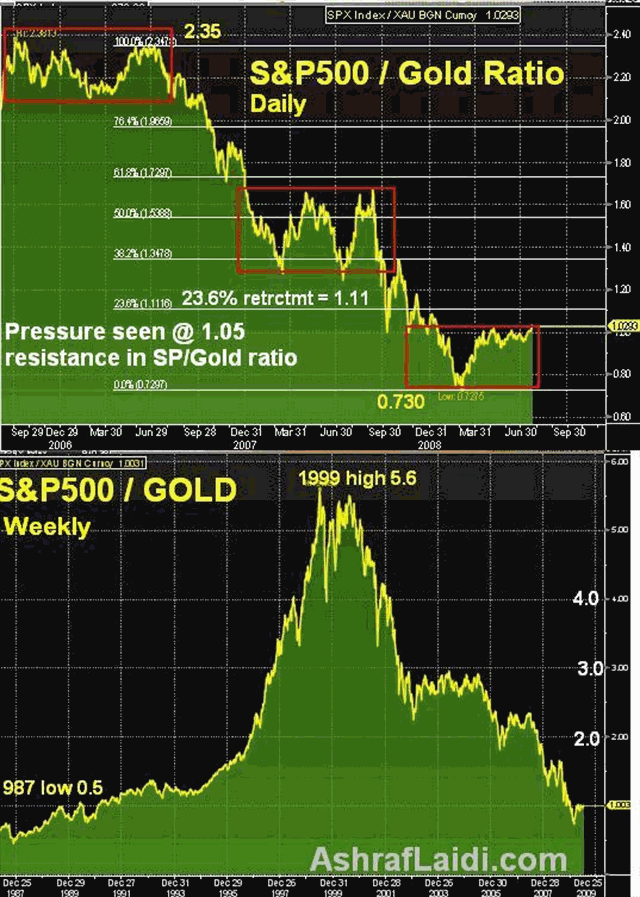
One week after the S&P500/Gold ratio rose to parity, the equity index has garnered further ground to hit 1.03, its highest level since January. The daily chart below shows the rising S&P/Gold ratio to be a result of the superiority of equities vs metals in March. But as the Fed began purchasing US treasuries in April, inflationary concerns stemming from a potential debasement of the US currency prompted capital into metals. The broadening advances in global risk appetite of the past 4 months have prompted gains in both gold and equities, leading to a consolidation in the equity/gold ratio.

The only viable means for the equity/gold ratio to regain its 2008 highs (S&P/Gold regains 1.10), would be for the Fef to begin withdrawing liquidity (exit strategy via selling back treasuries) without upsetting equity markets. At the present macro juncture, this is highly unlikely for at least the next 2 months. Only when unemployment has shown clear signs of peak and GDP growth emerges from slowing decline to positive growth, would a rally in equities be sufficiently strong to overcome a tighter monetary policy.
For now, with equities being overstretched in terms of valuations and nonsupportive macro climate (excessive emphasis on cost-cutting rather than revenue growth), a gradual retreat in stocks and metals is the more likely course into end of Q3. But the ensuing retreat in gold may not breach below the 880 level considering the escalating fiscal imbalances in the US Federal Govt as well as the individual States. Thus, we expect the recent ascent in equities relative to gold to be nearing its peak, without exceeding 1.05 in S&P500 / Gold, 9.5 in Dow30 / Gold, 1.7 in NASDAQ100 / Gold and 4.8 in FTSE 100 / Gold.
For a multi-year study on the 40-year cycles in Equities/Gold ratio, see our Forex & Intermarket Dynamics Workbook
By Ashraf Laidi
AshrafLaidi.com
Ashraf Laidi is the Chief FX Analyst at CMC Markets NA. This publication is intended to be used for information purposes only and does not constitute investment advice. CMC Markets (US) LLC is registered as a Futures Commission Merchant with the Commodity Futures Trading Commission and is a member of the National Futures Association.
Ashraf Laidi Archive |
© 2005-2022 http://www.MarketOracle.co.uk - The Market Oracle is a FREE Daily Financial Markets Analysis & Forecasting online publication.


