Gold Bull Market Guaranteed to Make new Highs During 2009
Commodities / Gold & Silver 2009 Jul 27, 2009 - 12:33 AM GMT Gold - For the week gold gained $14.10 (+1.50%) to close at $951.50 (continuous contract). This was the highest weekly close in the last seven weeks, so it is a positive development, especially if it holds.
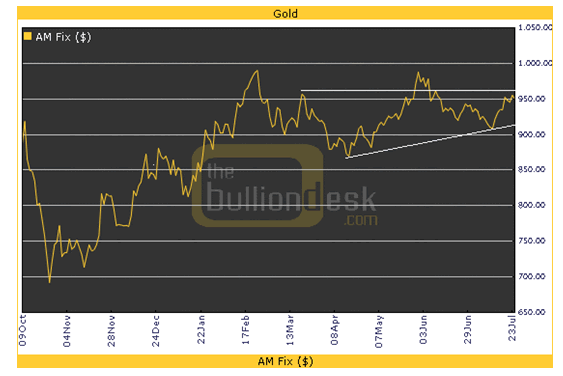
The daily chart below shows gold approaching overhead resistance, as represented by the late March high, which is marked by the upper white horizontal line on the chart.
Two important things to notice: higher lows have occurred; but so far higher highs have not occurred. For a bull market to obtain – higher highs must eventually develop. As long as the higher lows hold, all is well. Lower lows would call into question the validity of the gold bull market thesis.
It is my opinion that we are in a secular bull market of huge proportions and that gold will make higher highs before the New Year arrives, as the second chart that follows suggests.
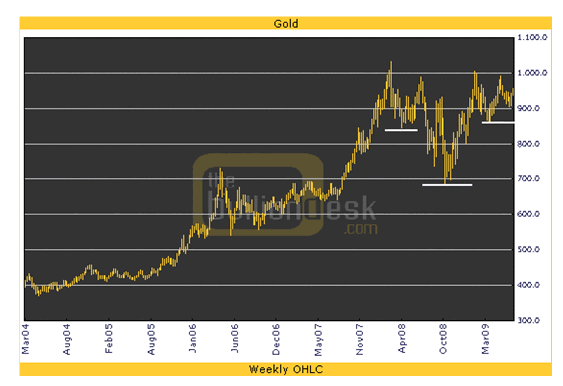
Below is the weekly gold chart. Evidence the head & shoulders formation at the right hand side of the chart.
Until neckline resistance at the $1000 price level is broken above on expanding volume, AND holds; the formation is only potential, not reality.
IF (?) it is confirmed, the upside target is $1300 ($1000 minus $700 = 300 - $1000 plus $300 = $1300). It could be less; or more, but at that point gold would be overbought; however, the stock market has been showing just how long overbought can obtain and get even more overbought. It is a lesson well worth remembering.
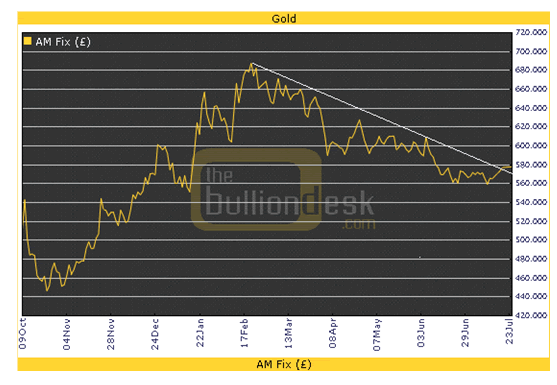
Next up is the daily price of gold in pounds (England’s currency). Notice the falling trend line that has just recently been broken above ever so slightly. The chart shows much work is needed to be done for a bull market priced in pounds to obtain. Price has declined from 680 to 580 (14.7%).
It is not imperative that gold makes news highs in all currencies to validate a gold bull; however, it does add credence. But such occurrences take time. First, one currency will make a new high, then another, and so on; as it must be remembered that all the currencies move or compete with one another; just as they compete with gold [see currency section for details].
Often gold is traded as a commodity. If a secular bull market is occurring, which I believe to be true – the power and force behind it will be the recognition that gold is the ultimate currency, the only currency worth its weight in gold, because it is no one’s liability. As paper money becomes worth less and less, always headed towards worthlessness – gold will shine the brightest. This is when it will once again be the sovereign of sovereigns.
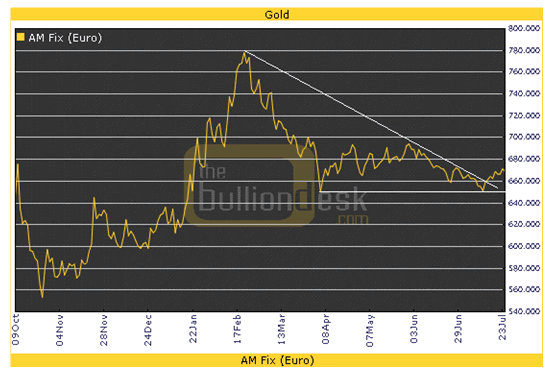
The chart below of the Euro shows a declining trend line as well. Price has fallen from 780 to 650 (-16.6%) and now resides at 670 (-14.1%). Once again, there is much work to be done here. The first upside targets are 690 and then 700. After that 720 is an important level, followed by 740-750.
Note that I do not expect a big rally in the US dollar (even if one occurs), although anything is possible, especially in today’s stressed out and pressurized system.
If the dollar does rally, however, the euro will decline, and so too will the price of gold; but I suspect that this will be a short term head fake, shaking out the last of the weak hands.
Silver
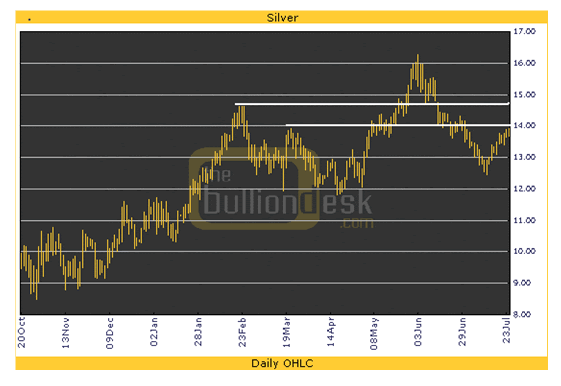
Silver was up +0.50 for a +3.73% on the week, closing at $13.90 (continuous contract). This was the highest weekly close in 4 weeks, as opposed to gold’s 7 weeks.
The daily chart shows silver bumping up into significant overhead resistance at $14.00, which goes back to March, and is indicated by the upper white horizontal trend line.
This is an important test for silver, at least short term. If it cannot break above $14 then it will likely test its recent lows.
So far silver has been making higher lows. This must continue AND then be followed by higher highs, which I believe is coming. Patience is needed.
I suspect there will be a time (and no one knows when) when silver will explode and play its game of “catch-up”. The silver to gold ratio is at extremes and will return to the mean, it’s a question of when – not if.
Platinum
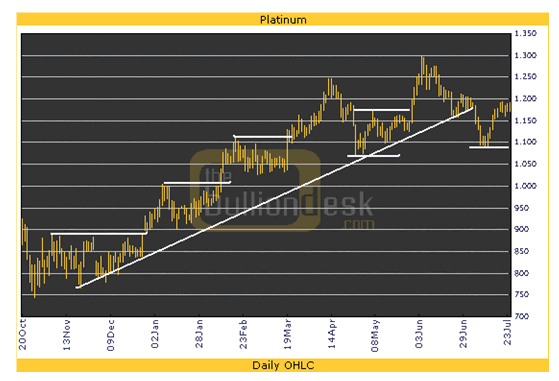
Platinum gained $15.30 for the week (+1.30%) to close at $1191.40 (futures price EOD index). This was the highest weekly close in three weeks, but much less than gold’s, and one week short of silver’s four weeks. However, since the Oct. – Nov. low, gold is up about 40%, silver about 65%, platinum around 58%, and palladium 64%.
The daily chart illustrates a series of higher lows connected by the rising diagonal trend line (white). Recently, the trend line was broken below; however, price firmed by making a higher low and is attempting to regain the trend line.
Note the short horizontal white lines that show consolidation after each rise and then a move to another higher high. The chart moves from the bottom left hand corner of the page to the upper right hand corner – a bullish signature – but the higher lows must hold and higher highs must follow.
Palladium
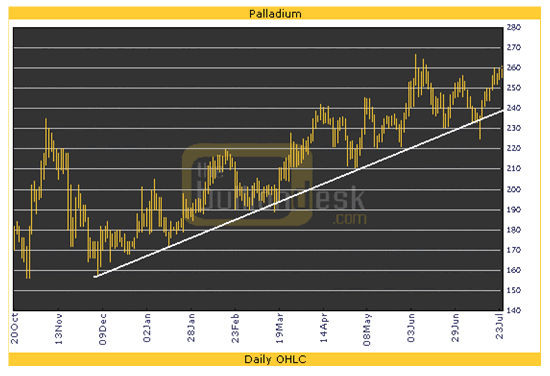
Palladium gained $11.75 (+4.69%) for the week, closing at $262.50 (futures EOD index). This was the highest weekly close in 45 weeks!
We also just noted above that since the fall lows that palladium is up 64%. Needless to say – palladium is performing quite well thank you. Before we get too excited, however, there are some caveats (always are).
Palladium is down 55% from its all-time high ($600). Platinum is down 43% from its high ($2299), silver is down 35%, while gold is down 7.9%. The U.S. dollar is down 35% from its high and the stock market is down 38%. Clearly, gold has performed the best.
Although it must be noted – to price any of the metals, especially gold and silver, in Federal Reserve Notes (paper dollar bills that are unconstitutional) is a mistake of the highest order. But right now it is all we have to work with; although we should demand change.
Gold Stocks
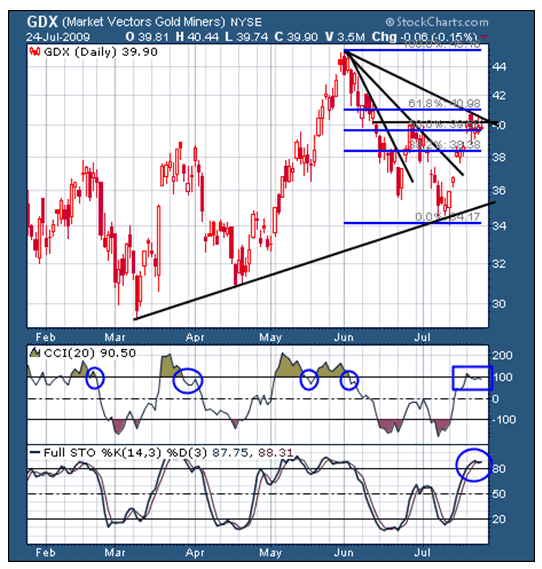
Gold stocks, as represented by the GDX index, gained +3.26% this week to close at 39.90. This was the highest weekly close in six weeks. The daily chart below shows several resistance and support levels.
Presently, price is bumping up into falling diagonal resistance and horizontal resistance – both near 40. The Fibonacci retracement levels from the June highs are indicated. Price is also bumping up against the 61.8% Fibonacci level. All of these converging resistance levels suggest a pullback is probable. Note CCI was above 100 and has declined below, which in the past preceded corrections all but one time.
The weekly chart of the HUI index shows some interesting data. From the Oct. – Nov. low the HUI rallied up 143% - a spectacular move in only 7-8 months time.
The question now is – has the index risen too far too fast? Evidence the chart below, which shows that at its recent lows around 30.7 that the HUI has only corrected to its first Fibonacci level (38.2%).
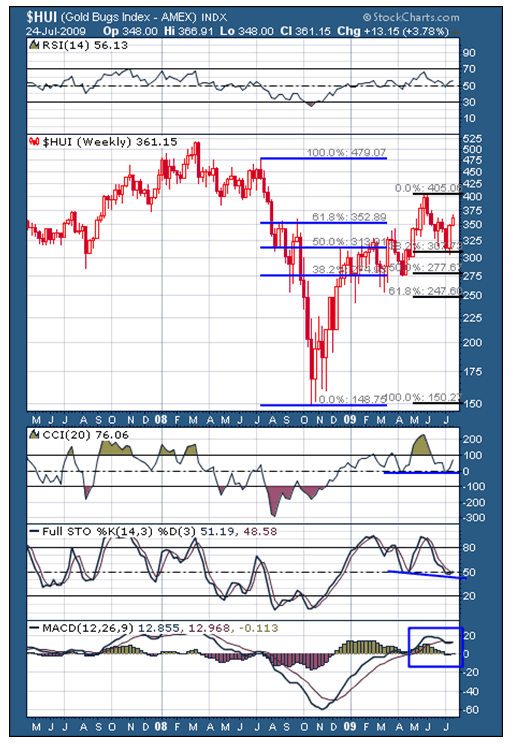
However, this could merely be a sign of strength and the market may never look back. I feel that some more consolidation and digestion may be needed. Usually, the stronger the base, the stronger is the move that follows.
Note, however, that CCI appears to have put in a double bottom at the zero level and is turning up. STO made a positive divergence (lower low, while price made a higher low) and is also turning up.
MACD has made a negative crossover, however. RSI has plenty of room to move up if it wants to. The signals are mixed.
One last thing to mention, which I have discussed several times before: although the gold stocks have put in huge moves since their lows last fall, they are down BIG TIME from their all-time highs of a few years ago.
I have written on how they are underperforming gold tremendously, as evidenced by gold’s 7.9% decline from its all-time high; while the gold stocks (GDX) are down 30% from their all-time highs (57-40=17/57=30%).
So far it has been more profitable to own gold than gold stocks, at least on a buy and hold basis. If one can trade the intermediate term moves, however, the gold stocks return much greater profits than buy and hold.
Money Back Guarantee
The above is an excerpt from the full market wrap report (39 pgs) available at the Honest Money Gold & Silver Report website. We are so bullish on gold that we are offering a money back guarantee to all new subscribers.
If gold does not make a new high during 2009 your subscription will be refunded in full. Stop by and check it out free. A free trial subscription is available by emailing your request to: dvg6@comcast.net.
Good luck. Good trading. Good health, and that’s a wrap.

Come visit our website: Honest Money Gold & Silver Report
New Book Now Available - Honest Money
Douglas V. Gnazzo
Honest Money Gold & Silver Report
About the author: Douglas V. Gnazzo writes for numerous websites and his work appears both here and abroad. Mr. Gnazzo is a listed scholar for the Foundation for the Advancement of Monetary Education (FAME).
Disclaimer: The contents of this article represent the opinions of Douglas V. Gnazzo. Nothing contained herein is intended as investment advice or recommendations for specific investment decisions, and you should not rely on it as such. Douglas V. Gnazzo is not a registered investment advisor. Information and analysis above are derived from sources and using methods believed to be reliable, but Douglas. V. Gnazzo cannot accept responsibility for any trading losses you may incur as a result of your reliance on this analysis and will not be held liable for the consequence of reliance upon any opinion or statement contained herein or any omission. Individuals should consult with their broker and personal financial advisors before engaging in any trading activities. Do your own due diligence regarding personal investment decisions. This article may contain information that is confidential and/or protected by law. The purpose of this article is intended to be used as an educational discussion of the issues involved. Douglas V. Gnazzo is not a lawyer or a legal scholar. Information and analysis derived from the quoted sources are believed to be reliable and are offered in good faith. Only a highly trained and certified and registered legal professional should be regarded as an authority on the issues involved; and all those seeking such an authoritative opinion should do their own due diligence and seek out the advice of a legal professional. Lastly Douglas V. Gnazzo believes that The United States of America is the greatest country on Earth, but that it can yet become greater. This article is written to help facilitate that greater becoming. God Bless America.
Douglas V. Gnazzo © 2009 All Rights Reserved
© 2005-2022 http://www.MarketOracle.co.uk - The Market Oracle is a FREE Daily Financial Markets Analysis & Forecasting online publication.


