


Investment Portfolio Diversification & Risk
Portfolio / Learning to Invest Jul 24, 2009 - 02:52 PM GMTBy: Andy_Sutton

 The cliché’s are plentiful and well known. Putting all of one’s eggs in a single basket is probably the most popular example. One of the biggest manifestations is when an investor looks at their portfolio and realizes that it is grossly underperforming a particular market index or that the same portfolio has performed much worse than a given benchmark. Even if you’ve done everything right and selected the right themes, industries, and firms, if you get the portfolio mix wrong, you can still have problems. This is one of headaches that mutual funds are generally supposed to relieve investors of, but for a litany of reasons, it doesn’t seem to always work out that way. In truth, every individual portfolio is a mutual fund of sorts, and so the same rules apply.
Types of Risk
In general, there are two broad types of risk: systematic (non-diversifiable) and non-systematic (diversifiable). Keep in mind that what we are discussing here is slightly different from geopolitical risk, currency risk, interest rate risk, etc although each of those specific types of risk do contribute to the overall riskiness of a particular stock and as such cannot just be ignored.
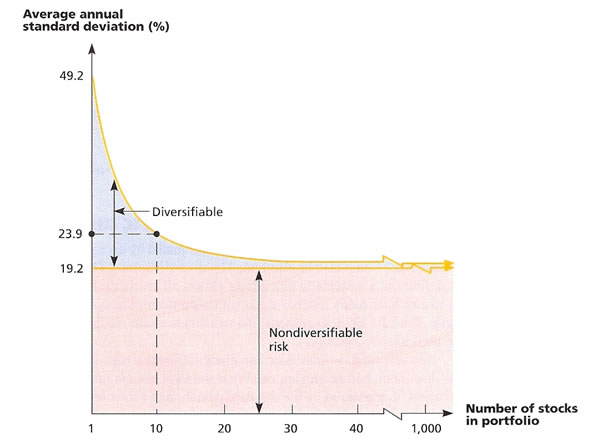
The data in the chart below is from a 1987 study on diversification just after the market crashed. Obviously, at that time, diversification was a hot topic as investors scrambled to adjust portfolios and recoup the losses. The data below lists the number of components, the standard deviation of annual returns for each portfolio, and a comparison of the standard deviation of the portfolio to that of a single component.
Below is a graphic representation of the data in the chart above. It may clearly be observed that standard deviation of the portfolio is asymptotic (law of diminishing returns) as it relates to eliminating the systematic (diversifiable) risk. In fact, once the number of portfolio assets surpasses 30, the standard deviation does not drop appreciably, even when another 970 components are added! Obviously, this reality enforces that quality is better than quantity.
Think of the case of the individual investor who buys 100 stocks thinking he is diversifying away all his risk. He has borne a significant opportunity cost in the form of commissions without purchasing much in the way of additional protection from non-systematic risk. The upper portion of the chart deals with non-systematic risk, which can be largely diversified away. Notice though that even when the portfolio contains 1000 components that the standard deviation is still 19.21%. That constitutes the systematic risk.
A good example of systematic risk is pure market risk. Obviously if the capital markets crash again as they did in 2008, it will be exceedingly difficult to put together a basket of stocks that will withstand such a downward draft. There are other types of risk such as geopolitical, currency, inflation, interest rate, industry, and geographic. By using a crosscut approach to diversification, one is able to not only mitigate much of the non-systematic risk, but a good portion of the systematic risk as well. This is accomplished by looking at your themes selected several weeks ago, then addressing each type of systematic risk in your selection of assets. This approach is one of the main reason that our Centsible Investor Model Portfolio has done so well while the broad markets have languished.
Beta (ß)
Quantitatively, Beta is the generally accepted measure of systematic risk for a stock and is defined as the amount of systematic risk present in a particular risky asset relative to that in an average risky asset. Essentially what Beta does is compares a particular stock in this case with an average stock, or more accurately, a benchmark basket of stocks:
where ra measures the return of the asset, rp measures the return of a portfolio of risky assets (often the stocks in an index), and Cov(ra,rp) is the covariance of the returns.
Interpreting Beta is rather simple. 1.0 is the Rubicon so to speak. Betas lower than 1.0 indicate that the stock in question has a lower level of systematic risk than the ‘market’ while a Beta of greater than 1.0 indicates a stock that has a greater level of systematic risk than the ‘market’.
Knowing this, it becomes a rather simple matter to calculate the Beta of your portfolio simply by ascertaining the weight of each component and then multiplying it by that component’s Beta. Let’s use a hypothetical example where we have a 3 stock portfolio; Stock A is 25% of the portfolio, Stock B is 40% of the portfolio, and Stock C is 35% of the portfolio. The Beta of Stock A is .75, Stock B is .50, and Stock C is 1.25:
Betaportfolio= .75(.25) + .50(.40) + 1.25(.35)
Betaportfolio = .83
This calculation indicates that this 3 stock portfolio has systematic risk that is lower than that of the market, however, its non-systematic risk would be considerably higher than one would desire since there are only 3 components. All else being equal, the ideal would be to find a portfolio of perhaps 25-30 stocks that has a Betaportfolio of .83, as this would mitigate much of the non-systematic risk as well.
Beta and the Risk Premium
While using the term risk-free in today’s financial and economic climate might result in a shower of protest, the concept of the risk-free asset has an important place in the discussion of risk vs. reward, particularly when selecting portfolio assets.
Let’s use an example of a stock with an expected return of 20% and a Beta of 1.6. Let us also assume (entirely for illustrative purposes) that the risk-free asset has a return of 8%, with a Beta of zero since it has neither systematic nor non-systematic risk. In the case of expected return, we are relying on an educated guess, but in the case of stocks that pay dividends, one could easily plug the dividend yield into the expected return as well. When we plot out our stock and the risk-free rate and generate a Security Market Line (SML), we get the following:
The chart above is relatively easy to interpret; we consider the ‘risk-free’ asset Rf with its corresponding Beta of zero and return of 8% and our stock with its Beta of 1.6 and its expected return E(RA) of 20%. When we connect the dots and measure the slope of the line (rise/run), we get a slope of 7.5%. From this graph, we can ascertain that our stock has a reward to risk ratio of 7.5% meaning that our stock has a risk premium of 7.5% for each ‘unit’ of systematic risk. Obviously, the higher the reward to risk ratio, the better, meaning we’d want to see higher E(RA) and/or lower Beta; either of which would increase the slope.
In a final example, let us now compare our stock in the previous example (called Stock A) with a second stock (Stock B). Stock B has a Beta of 1.2 and an expected return E(RB) of 16%. When we construct our Security Market Line, we end up with a slightly different picture than we had with Stock A.
The reward to risk ratio (or slope of the line) for Stock B is 6.67%. What this tells us (all other things equal) is that in essence, Stock A is a ‘better’ choice than Stock B simply because it generates more reward for each unit of systematic risk undertaken.
This analysis is especially useful when one is selecting portfolio components and wants exposure to a particular industry or sector, has multiple candidates, but doesn’t want to include them all for fear of being overweight that particular area. In this manner, the candidates may be lined up and compared to see both visually and quantitatively where the best bang for the buck lies.
Of all the areas discussed in our sample exercise over the past few weeks, diversification and risk are the two areas where investors are most likely to stumble. Many fail to properly diversify because they don’t understand the value of it or because they don’t have enough capital to diversify by purchasing individual stocks and should look to ETFs, open-end or closed-end funds as an alternative. While the analysis above was primarily for stocks, those investors seeking to hedge their portfolios with precious metals can certainly plug their favorite shiny coins into this analysis. For those so inclined, Betas may be hand/Excel-calculated for commodities using the major indexes, or commodity indexes, such as the CRB as the ‘market’ portion of the calculation.
In summation, probably the most important takeaway from this article should be that a portfolio doesn’t need 100 components to be adequately diversified in terms of non-systematic risk. 30-40 will do just fine. A second important point is that by using your economic themes and how they relate to systematic risks in your selection of an appropriate number of assets, you can mitigate a good deal of the systematic risk to your portfolio as well.
By Andy Sutton
http://www.my2centsonline.com
Andy Sutton holds a MBA with Honors in Economics from Moravian College and is a member of Omicron Delta Epsilon International Honor Society in Economics. His firm, Sutton & Associates, LLC currently provides financial planning services to a growing book of clients using a conservative approach aimed at accumulating high quality, income producing assets while providing protection against a falling dollar. For more information visit www.suttonfinance.net
Andy Sutton Archive |
© 2005-2022 http://www.MarketOracle.co.uk - The Market Oracle is a FREE Daily Financial Markets Analysis & Forecasting online publication.