Most Popular
1. Banking Crisis is Stocks Bull Market Buying Opportunity - Nadeem_Walayat
2.The Crypto Signal for the Precious Metals Market - P_Radomski_CFA
3. One Possible Outcome to a New World Order - Raymond_Matison
4.Nvidia Blow Off Top - Flying High like the Phoenix too Close to the Sun - Nadeem_Walayat
5. Apple AAPL Stock Trend and Earnings Analysis - Nadeem_Walayat
6.AI, Stocks, and Gold Stocks – Connected After All - P_Radomski_CFA
7.Stock Market CHEAT SHEET - - Nadeem_Walayat
8.US Debt Ceiling Crisis Smoke and Mirrors Circus - Nadeem_Walayat
9.Silver Price May Explode - Avi_Gilburt
10.More US Banks Could Collapse -- A Lot More- EWI
Last 7 days
Stock Market Volatility (VIX) - 25th Mar 24
Stock Market Investor Sentiment - 25th Mar 24
The Federal Reserve Didn't Do Anything But It Had Plenty to Say - 25th Mar 24
Stock Market Breadth - 24th Mar 24
Stock Market Margin Debt Indicator - 24th Mar 24
It’s Easy to Scream Stocks Bubble! - 24th Mar 24
Stocks: What to Make of All This Insider Selling- 24th Mar 24
Money Supply Continues To Fall, Economy Worsens – Investors Don’t Care - 24th Mar 24
Get an Edge in the Crypto Market with Order Flow - 24th Mar 24
US Presidential Election Cycle and Recessions - 18th Mar 24
US Recession Already Happened in 2022! - 18th Mar 24
AI can now remember everything you say - 18th Mar 24
Bitcoin Crypto Mania 2024 - MicroStrategy MSTR Blow off Top! - 14th Mar 24
Bitcoin Gravy Train Trend Forecast 2024 - 11th Mar 24
Gold and the Long-Term Inflation Cycle - 11th Mar 24
Fed’s Next Intertest Rate Move might not align with popular consensus - 11th Mar 24
Two Reasons The Fed Manipulates Interest Rates - 11th Mar 24
US Dollar Trend 2024 - 9th Mar 2024
The Bond Trade and Interest Rates - 9th Mar 2024
Investors Don’t Believe the Gold Rally, Still Prefer General Stocks - 9th Mar 2024
Paper Gold Vs. Real Gold: It's Important to Know the Difference - 9th Mar 2024
Stocks: What This "Record Extreme" Indicator May Be Signaling - 9th Mar 2024
My 3 Favorite Trade Setups - Elliott Wave Course - 9th Mar 2024
Bitcoin Crypto Bubble Mania! - 4th Mar 2024
US Interest Rates - When WIll the Fed Pivot - 1st Mar 2024
S&P Stock Market Real Earnings Yield - 29th Feb 2024
US Unemployment is a Fake Statistic - 29th Feb 2024
U.S. financial market’s “Weimar phase” impact to your fiat and digital assets - 29th Feb 2024
What a Breakdown in Silver Mining Stocks! What an Opportunity! - 29th Feb 2024
Why AI will Soon become SA - Synthetic Intelligence - The Machine Learning Megatrend - 29th Feb 2024
Keep Calm and Carry on Buying Quantum AI Tech Stocks - 19th Feb 24

Market Oracle FREE Newsletter

How to Protect your Wealth by Investing in AI Tech Stocks

S&P Stock Index Building into a New Bull Market

Stock-Markets / Stocks Bull Market Jul 24, 2009 - 08:19 AM GMT

By: Seven_Days_Ahead

Stock-Markets

Best Financial Markets Analysis ArticleThe Technical Trader’s view:


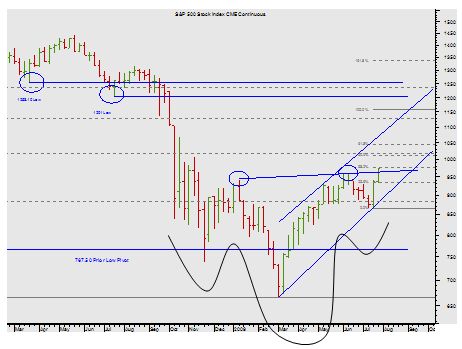
WEEKLY FUTURES CONTINUATION CHART

The drama of the market is clear enough: a Head and Shoulders Reversal may have completed.

Traders need the close on the week to be above the Neckline…but that may be to wait to long.


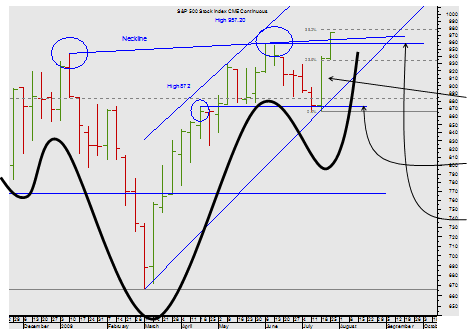
WEEKLY FUTURES CONTINUAITON CHART

This is fascinating: note the nearly weekly Key Reversal, which was the result of bouncing of the Prior High support at 872.

The market has got back through the recent High at 957.20 giving an additional stimulus …
And now the first break of the Neckline -completion of the H&S Reversal pattern?
Look closer still…

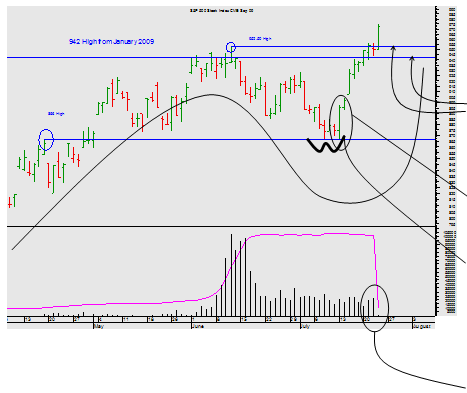
DAILY FUTURES CHART
The simultaneous break up through the 942 High and then the 952.50 high will certainly stimulate fresh short-term buying.

The true Day Key Reversal from the 13th July 2009 is clear – and note that is it also a Double Bounce from the 866 High.

The market has smashed the Prior High Pivots.

All in good volume

Fresh buying to come!

The Macro Trader’s view:
After almost three months of sideways price action following a rejection of the lows, the S&P is on the verge of re-establishing a new bull run.

The earlier rally away from the lows of March was fuelled by belief the US was emerging from recession and would begin to grow again later in the year, but that optimism gave way to serious doubts over the economy’s ability to grow when the Banks were still, if not in intensive care, not yet ready to check out of Hospital.

But sentiment in markets can change quickly. In recent weeks exactly that has occurred: traders have again begun to believe the US economy is on the mend as the leading economy.  Banks have reported stronger profits at the same time as macro-economic data has continued to show improvement.

  1. the ISM non-manufacturing survey has continued to advance closer to 50.0,
  2. Pending home sales have increased,
  3. Housing starts and building permits have strengthened, and
  4. Retail sales have been broadly stronger than expected.

Additionally, the Fed has stopped worrying about deflation and expects the economy to begin growing later this year, and although a rapid recovery isn’t expected, and they expect unemployment to rise a little further, the worst of the crisis looks past. Today, Goldman Sachs became the first US Bank to repay the bailout funds it received at the height of the financial crisis, with other leading Banks likely to follow.

And as the quarterly reporting season goes on and several bell weather firms in the consumer sector ( Starbucks and Apple) report better than expected results that suggest the consumer remains alive and well, equity markets look buoyant. 

While data could yet throw out the odd unhelpful surprise, which s occurs at major turning points in the cycle causing traders to pause, we believe the S&P is building into a new Bull Market. As ever, timing entry will be the key.

Philip Allwright
Mark Sturdy

Seven Days Ahead
Be sure to sign up for and receive these articles automatically at Market Updates

Mark Sturdy, John Lewis & Philip Allwright, write exclusively for Seven Days Ahead a regulated financial advisor selling professional-level technical and macro analysis and high-performing trade recommendations with detailed risk control for banks, hedge funds, and expert private investors around the world. Check out our subscriptions.

© 2009 Copyright Seven Days Ahead - All Rights Reserved
Disclaimer: The above is a matter of opinion provided for general information purposes only and is not intended as investment advice. Information and analysis above are derived from sources and utilising methods believed to be reliable, but we cannot accept responsibility for any losses you may incur as a result of this analysis. Individuals should consult with their personal financial advisors.

Seven Days Ahead Archive

© 2005-2022 http://www.MarketOracle.co.uk - The Market Oracle is a FREE Daily Financial Markets Analysis & Forecasting online publication.


Comments

Derek
02 Aug 09, 00:48
New bull market run--you hit the nail on the head

I'm also a technician, and you have reinforced points I've been preaching to friends, family, blogs, LOL, anyone who will listen to me!! The pull back from 955 was a clear "expanded flat" correction pattern, which ended the morning of 11/13. In fact, the prior evening, S&P futures made an extremely similar move, as you stated, testing 869 during the overnight session and bouncing furiously off of that level up past 880. The reversal in the cash market happened that morning in the first hour of trading.

Now where do we go from here? With a new high for the year, and the comfort of reaching pre-cliff dive levels, and the market hesitation last week, I think most are convinced we've seen all we'll see from bulls in 2009.

WRONG!! WRONG!!! WROOOOOOOOOOOOOONG!! The march rally was wave 1 in the elliot wave pattern of this uptrend. That wave was comprised of 5 fractals, and ended with the typical complex correction that lasted nearly a month. Correction? that was fractal wave 2 of this larger run.

Now, for phase 3, which will undoubtedly be the eye-opening largest percentage move of the uptrend. Rally over? haha we've only just begun. We will discover that the week of 7/27 which saw practically no movement in the S&P was fractal 2 in the mini elliot wave pattern making up the bigger picture wave 3.

That leaves us as follows: in phase 3 of a bull run, entering the 3rd fractal of the 5 wave impulse within that phase. In other words: the next 2-3 weeks will make march through now look like a blip on the chart.

Make no mistake about it--we've going to see S&P 1000, we're going to see S&P 1050. I think 1100 will mark the end of phase 3, and after another correction, we'll break 1100 on wave 5.

So the only thing I need to figure out, is where we're going after we break 1100. For now, get most of your cash off the sidelines, pick a basket of 3-5 stocks with little fundamental news or risk between now and September and "let it ride" as they say. I'm going with mostly stocks that I bought before their earnings reports, and have held up well despite huge rallies after beating numbers: starbucks, bank of hawaii, ATT. Also some sub $10 stocks that should rise with the tide too--AXL poised for another huge breakout this week with a MACD bullish signal line crossover on Friday, and Genworth Financial my 2 biggest small stock plays there. Genworth has been lit up by institutional buying the last 2 months. Already up from below $1 in February, this stock could end up being the greatest story of 2009 when its all said and done. Look at the way high volume buyers plowed into the life insurers last week despite the posted investment losses.

good luck to all. Please please please do not short this market!!


Post Comment

Only logged in users are allowed to post comments. Register/ Log in