


Which Metal Is Shining More, Copper or Gold?
Commodities / Metals & Mining Jul 20, 2009 - 07:17 PM GMTBy: Bill_Downey

 For any investor trying to sum up the copper situation, he/she must come to grips with many conflicting forces all vying to affect its price. The mass media continues to send signals that the worst is over and recovery is at hand in the global market place. Meanwhile some pretty savvy analysts on the internet are telling us to hold on to our buttocks as the next wave of credit contraction is upon us this fall as the commercial real estate market is about to embark on the same road as the residential real estate market followed last year. If this is the case then the markets could be in for another bout of cascading selloffs as were witnessed last year. Let’s discuss both, and then look at the price charts to see if they offer clues and potential tactics we might employ.
Let us first look at the economic recovery. Is there really a recovery going on? Well, there is certainly a bounce from horrific levels we saw last year in almost all markets. The latest reports suggest that China has been buying up commodities and grains while prices are low. That data is correct. They have been huge buyers of both. While there are many reasons for China to do so, stock piling is not a LONG TERM bullish factor in any market. However, should an economic turnaround really develop and the China miracle does indeed resume, then a bullish case for a new commodity rise may indeed have merit. Such bullishness however is not necessarily a guaranteed event.
As we have witnessed over the past decade, prices can, will, and do swing wildly, and copper has been no exception either. Rather than trying to discern the economic tea leaves today, let’s take a look at the price history of copper to see if there’s something there that we can discern from the past and maybe get a better perspective of the future. The best place to start is the long term.
The copper chart below is from 1960 to 2006.
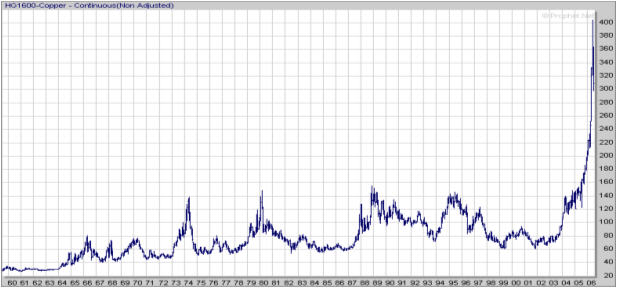
As you can see, for some 40 odd years, copper traded between the 40 cent and the $1.60 cent price range. There are a few things we can discern from this price action. The first is that when copper moves, it moves in big percentage terms. From the beginning of 1973 to early 1974 the price of copper tripled from about 50 cents to $1.40 in about 14 months. Recall that the first Crude Oil shocks the USA received was in the same time frame, and if I am not mistaken, gold had its first big rally around that time period as well. Just as fast as she went up, copper came a tumbling down right back to where the initial rally began from. Now this is a great example for us to understand that the collapse in copper this year all the way back to the $1.20 area is not an isolated event. In fact, the rise from 1977 into 1980 also witnessed pretty much a tripling of price and a subsequent drop all the way back to its original starting price range. This second major rise culminated with the precious metals peak of 1980 when gold reached 875 per oz and silver an astounding $50 dollars per ounce. This second major peak would take seven years to bottom out in the copper market. As before, it would retrace all of the price gains.
Most interesting is that the 1987 bottom and subsequent rally began right after the stock market crash from that year (which is what we’ve seen since spring this year). The 1987 rally began at the 80 cent level and doubled reaching a new all time high at $1.57. This price peak would last 17 years before being exceeded again.
From 1989 thru 1994, copper prices once again drifted lower, this time along with the mini housing correction of that time. But in December of 1994, copper once again embarked on a year long rally that would double the price of copper from about the .70 cent level to just under $1.40. Here price stayed in a narrow range for all of 1995 but eventually buckled in 1996 as the precious metals market embarked into its final wave down in price. The eventual low for copper came in 1999 and in December of 2001. Here again we see that copper bottomed near the precious metal (stock) lows of 1999, and also copper’s 2001 low coincided again with the stock market crash lows shortly after the 911 incident as well as the beginnings of the Gold bullion bull market.
For the next 22 months (2002-2003) copper traded in a very narrow 10 cent range between 70 and 80 cents. It was the quietest period for copper in over 10 years.
During this time the precious metals launched their first big rally since 1987, and as it turned out to be, the biggest rally in 20 years for gold and silver. Consequently a strange phenomenon occurred in the markets of that time. THEY ALL STARTED GOING UP. All with the exception of the US dollar, as that one went in the opposite direction. But it didn’t matter whether you were in gold or stocks, or real estate, heck…….EVEN BONDS !!!!!!! All markets were going up. And copper was not about to be left behind.
After meandering in the $1.20 to $1.40 area for all of 2004 and into the fall of 2005, copper began an autumn move from $1.20 to $1.60 going into December. From this December timeframe a MAJOR acceleration began and by early 2006, copper broke above the $1.60 area and penetrated its 17 year high point. It was at this point that the China miracle was in full play, gold had finally broken above 525 for the first time in 20 plus years and even the American stock market, which had been given a 50% haircut, began a recovery that would eventually lead the Dow to new highs and the S&P to match its previous all time highs as well. Copper would eventually move from .80 cents to over $4.00 going into 2008.
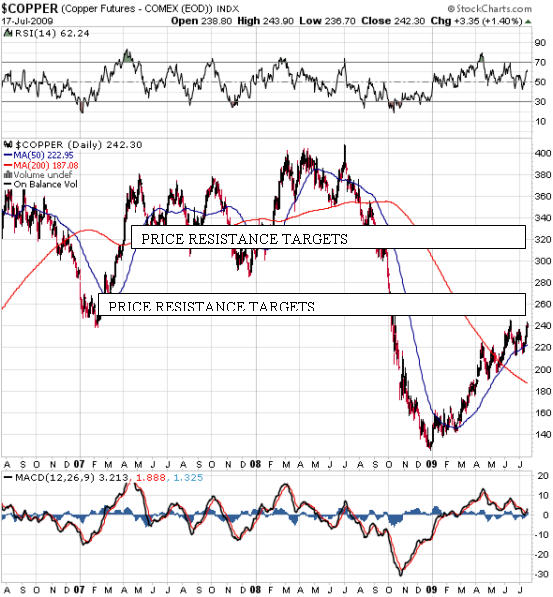
Now we’re going to zoom back in and look at our price chart over the last three years. The first thing I want to bring to your attention is how many times in the above paragraphs that I mentioned the month of December. Not necessarily December, but the December to March time frame has been a major turning point for copper many times in the past. Some have been major highs, and some have been major lows. We can see this confluence much more so in the chart below. Look at the last three years. Where have been the major lows? That’s right. In the December/February timeframe, copper has made it’s lows in this timeframe.
First and foremost, the December/March time frame is a great time to look for a low or a high. Look at the highs of 1966, 1968, 1970, 1974, 1980, 1989, 1995, and 2000. All of these highs occurred in the Jan to March timeframes. How bout the lows? The September to December time frame is a great time to look for a low. Look at the Sept/December times in 1967, 1968, 1972, 1975, 1978, 1986, 1989, 1991, 1993, and 2002. All provided rallies, some big, some not so big.
Secondly, copper has a tendency to rally during economic booms, when stock markets make a bottom, or rising precious metals are in play, and yes, during a housing boom.
Third, copper prices, once they begin to trend usually rise anywhere from 100 to 400%, depending on how many of the above actions are in play. The 400% rise witnessed this decade came at a time when housing prices were soaring to all time highs, precious metals were soaring to all time highs, stock markets had bottomed from a massive correction, and China was in an economic boom. Our friend Mr. Copper was firing on all cylinders and prices moved dramatically.
Conclusions
Now we finally arrive at today. What are we to make of copper at this time? First let’s address the collapse that copper saw as it went from $4.00 to $1.20 over the past year. Our chart of the past shows us that this is a typical copper move and we should not be alarmed by it. Copper has repeated shown that its corrections usually wipe out most or all of the previous gains. More importantly, it seems that the long term chart of copper has a new BASE PRICE. For 40 years copper traded in a range where the highs were defined in the $1.20 to $1.60 area. In now seems that this area is going to be the NEW SUPPORT band for copper.
What about time periods between rallies? Here, the odds are not with us. Of all the major rallies in copper over the past 50 years, there has never been one incident where copper didn’t wait at least 4 years before returning to its subsequent price highs. What this is suggesting is important. It is suggesting that the recent rebound in copper is not a rally that is heading to the $ 4 dollar area again. While it is not impossible, the ODDS do not favor it. Inventory drawdown has certainly been witnessed in some reports, and China has been stockpiling. But again, stockpiling is not that bullish, and in some cases, can have bearish consequence. Should the economic rebound…….you remember, those “green shoots,” …….well should they not get enough water, not enough sun, not enough nutrients, too much sun, too much water, and not enough TLC, they could end up looking like some of the experiments and experiences you and I have seen in our back yards at one time or another. Should this occur, or should those green shoots turn out to be nothing more than “fresh moss,” the potential for copper to end its rally near the 260-280 area will be significant and a return back towards the $1.20 area a distinct possibility. However, should the rebound continue a bit further, the potential to move to the $2.85 - $3.20 area will probably be achieved if we can overcome the current resistance that copper is currently at ($2.45-$2.53).
What about the precious metals, won’t copper ride along with them during their bull market explosion? That is a very valid question, and a very valid possibility. I think it has potential as long as we don’t globally collapse, but even then, we are going to have to rely a lot on China. Should gold break out above $1075 and should we start getting bouts of inflation that will somehow continue to allow the world economy to meander along, then yes, copper will have the potential to continue its rally. This too is not an odds favorite, but is not out of the realm. One thing we have to face is in this environment, ANYTHING IS POSSIBLE. A currency collapse will propel gold, silver, and to some extent, copper. What I am stressing here in this update is what the most likely ODDS are, not absolutes.
What Next?
Given our ride down memory lane in copper the following is the odds favorite for what will develop in copper.
The most likely event is that the current rally in copper is a rebound play that most likely will end in the November to March timeframe, somewhere in the $2.85 to $3.25 area. Now, this is based on a few assumptions. First, that the stock market rebound is not complete, and that the precious metals are not going to fall out of bed this summer. Second, that copper is going to move above the current resistance area of $2.45 - $2.53 and lastly, that China somehow will have better consequence in beefing up their economy artificially than the United States will. Should all three of these situations continue, then copper’s rally is probably not complete yet and has the potential to rally into late this year or early next year. Should these assumptions be incorrect, and gold, stocks, China and the rest of the world economy resume their “cascade down” this fall triggered by possibly the coming commercial market mortgage meltdown, then all bets are off, and copper will either peak here ($2.45-$2.53) or very shortly at the $2.85ish area.
Let’s look at one more item that might give us a perspective of what copper might do. But this time, let’s look at stock symbol FCX, better known as Freeport Mcmoran Copper and Gold. The stock trades on the NYSE and is I believe the world’s largest copper producer. As you can see by its price pattern, it is a great play on copper as the leverage factor is much greater. We’ve discussed how copper has had 400% rallies, but FXC had a run from 15 to 120 before its collapse along with the rest of the world in 2008. Its return to $20 was a rare opportunity in 2008. But more importantly, I want to overlay an indicator on this chart that might provide further insight as to why I think copper still has a way to go. Notice if you will the BLACK OVERLAY that is on this price chart below. This is an indicator I use that measures a bullish investor buy statistic. NOTICE this black line performance in March of 2007, how it exploded up and how price shortly after that began a price run from 70 to 120. Now let’s look at today. Look at this indicator today!!!! Even during this correction, the black indicator is making new highs. This is suggestive that odds favor that price at the very least should move from 55 to resistance at 65-70, with the potential for more should we break above the seventy area.
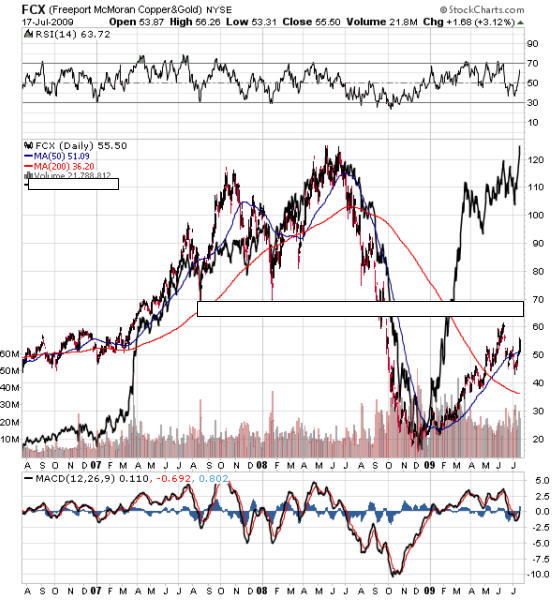
I’m not a big fan of technical indicators for main trading, but I do look at them from a coincidental frame of mind. And MACD sure looks like she is trying to turn back up from the zero area. Notice also the HUGE and sustained volume in this stock. IT IS SIGNIFICANT and has been at this elevated level all year practically. What I find the most interesting is how much HIGHER the black line indicator is than the current price. This line followed price for almost three years and now, it is way above it. Without giving away this indicator I can say this about it. It may not guarantee that price is going higher, but the MAJORITY that have traded this stock in the past 6 months are certainly betting on it. In fact, what this indicator shows is that they are not only buying, but they are CHASING the price. (That is basically what this indicator measures).
A good exercise from a due diligent investor would be to check out the March 2007 timeframe to see if that buying had INSIDER buying correlation, and whether this latest timeframe say January thru March of this year also had insider buying. That would further the case for higher prices.
Bottom line:
If copper overcomes the current resistance area of $2.45-$2,53ish, then the odds favor that copper will move to the $2.85 to $3.25 area sometime between November and March in the coming months. One of the stocks most likely to gain from that rise would be FCX. Some technicals look strong there. After a pullback under the 50 day moving average, price has jumped right back above it. Notice to that the 50 day crossed above the 200 day average this year as well. This is yet another good sign for the stock. One note…….the metals can be prone to an August to October dip. A savvy investor might play this with a small purchase here and then adding should the 200 day average be tested. This would cushion the downside while providing an opportunity to add at a good spot. Should the stock not move lower, all the better as the trade will be in the plus from the get go.
The key going forward is what copper and FCX are going to do at their resistance areas. Copper is already at its area, and FCX is about ten bucks away from its. Odds favor further upward movement in copper and the stock market, and FCX should see a ten dollar rise at a minimum with the potential for much more. Let us keep in mind to that the summer months can be choppy for the metals, and copper is no different. In fact, copper usually see’s its weakness during this time of the year. We’ve seen a bounce since the correction in June, and we are now at first level resistance. This is why a copper bull might only want to take a small position here, and add if a subsequent pullback occurs in late summer or early fall. Remember the old adage in stocks, bulls make money, bears make money, but pigs get slaughtered. Be always prudent.
I am not advocating that one buy FCX nor am I trying to push this stock as opposed to others in this group. I selected it as it is a convenient and easy way for the average investor to participate should the copper price advance continue. For while there is greater leverage in a company like this, there is also greater risk of loss as we are dealing with a company and not a commodity. Always keep that in mind and always use stops. An investor has to have the mind of a baseball player, knowing that he is not going to get on base every time he steps to the plate. Therefore, he must minimize his loss during the times that he or she strikes out. May you all prosper.
If you would like to receive Free Gold Analysis please visit my site: www.TechnicalCommodityTrader.com
May you all prosper.
William – “The Lone Trader”
http://www.technicalcommoditytrader.com
© Copyright Bill Downey 2009
Disclaimer: The above is a matter of opinion provided for general information purposes only and is not intended as investment advice. Information and analysis above are derived from sources and utilising methods believed to be reliable, but we cannot accept responsibility for any losses you may incur as a result of this analysis. Individuals should consult with their personal financial advisors.
© 2005-2022 http://www.MarketOracle.co.uk - The Market Oracle is a FREE Daily Financial Markets Analysis & Forecasting online publication.