China Surging Money Supply a Strong Driver for Inflation and Commodities
Commodities / CRB Index Jul 20, 2009 - 02:10 AM GMT Honest Money Gold & Silver Report - According to the data published by the People's Bank of China on July 15, the broad money supply (M2) expanded more than 2 trillion Yuan in June alone, to 56.89 trillion Yuan. That’s an increase of 7.28 trillion so far this year (14.6%) and a year on year increase of 28%.
For all the jawboning China does about the United States over-issuance of money, they’re not doing too bad themselves. The Chinese money supply is rising at its fastest pace in more than 12 years, and foreign-exchange reserves have gained the most since the global financial crisis began.
As if that were not enough, China’s 5-Year Government Bond yields are near 2.8%. At the beginning of the year they were approximately 1.6%. This is the highest level since 2007, but it is important to note that rates reached over 4.5% during 2007, so they have retraced less than about 28.8% of their decline – less than the first Fibonacci retracement level. Nevertheless, interest rates are on the rise and perhaps significantly so.
This is worth keeping an eye on. If Chinese rates continue to rise it could impact not only the dollar, but the price of commodities as well. China has been a recent big buyer of commodities, especially metals. Higher rates could put pressure on the dollar, in turn causing commodity prices to rise. At this point this is only speculation, but it bears watching.
The following excerpts are from the Swiss Central Bank’s Yearly Report on China:
China - Annual economic report - June 2009
Although China’s finance sector is not directly affected by the financial crisis, China’s real economy was hit hard by the global economic downturn. For the first time in five years, China only reached a single-digit growth rate of 9.0% in 2008. In terms of quarters, it was up 10.6% for the first quarter, 10.1% growths for the second, 9.0% for the third and 6.8% for the fourth.
In the first quarter of 2009, the growth rate declined further to 6.1%, the country’s lowest quarterly growth in gross domestic product in nearly two decades.
The government quickly reacted to the downturn with the announcement of an RMB 4 trillion (US$ 586 billion, Euro 458 billion) past November and an aggressive loosening of monetary policy.
Therewith, China’s macroeconomic policies experienced a dramatic change – from “preventing economic overheating and curbing inflation” at the beginning of last year to “maintaining growth through expanding domestic demand”.
The most pressing priority for the Chinese government is to support economic growth amid concerns that rising unemployment could lead to widespread social unrest.
The People’s Bank of China (the central bank) has loosened monetary policy in recent months by lifting loan quotas, drastically reducing interest rates and cutting the reserve requirement ratio. Credit lending has increased significantly since the beginning of this year.
In the first quarter, credit lending stood at RMB 4.6 trillion, almost as much as for the entire year of 2008 and 20% higher than in 2007. Although new lending has moderated in April-May, some officials have expressed unease with the rapid growth of bank lending which could lead to a misallocation of credit, rise in nonperforming loans and increases the risk of an asset market bubble.
China’s huge foreign reserves of US$ 1.95 trillion remain a hot topic for many discussions. China holds the largest part of its foreign assets in U.S. treasuries. In past months, several high-level Chinese officials have expressed their concerns about the safety of Chinese assets as they fear that the massive U.S. spending could undermine the value of treasuries and some have called for the creation of a new reserve currency. So far, China continues to buy US treasuries but the government is making plans on how to make the Yuan more useful across Asia and make its currency system less depending from the US dollar.
Exports have significantly contributed to China’s GDP growth in recent years. Due to the financial crisis and the slumping global demand, China’s exports and imports dropped in the past months. In 2008, the total trade value reached US$2.56 trillion, a growth of 17.8% compared to the previous year. The growth rate dropped below 20% for the first time since seven years. Exports were up 17.2% to US$1.43 trillion and imports reached US$1.13 trillion, up 18.5%. Therewith, China’s trade surplus reached US$295.5 billion, a growth of 12.5% over the previous year.
In 2008, China mostly imported from Japan (13.3% of total imports), Taiwan (9.1%) and the U.S. (7.2%). The country’s main export destinations were the U.S. (17.7% of total exports), Hong Kong (13.3%) and Japan (8.1%). With China’s major export markets all in recession, exports have been falling on a monthly basis since last November.
Imports were depressed by destocking of raw materials and sharply lower commodity prices pushed down the nominal value of imports. In the first five months of 2009, China’s export fell by 21.8% amounting to US$ 426.1 billion while its imports fell even more by 28%, totaling to US$ 337.3 billion.24 The continued decline of exports diminished hopes that the collapse in external trade flows has bottomed out. Although trade is declining, most analysts expect China’s trade surplus to persist.
The unexpected deterioration in China’s export prospects is causing concerns to the government. According to the State Council, the falling exports are the biggest challenge for China’s economy. Declining orders and weak sales have forced the closure of many enterprises, particularly in the export-reliant industrial sector. According to official numbers, up to 8.7 million people have lost their job.
Commodities
Commodities generally move opposite of the dollar. As the dollar fell from March to June, commodities staged a big rally. Since June the dollar has basically traded sideways, yet commodities fell 11% and are presently down 5.8%. IF (?) the dollar were to rally, commodities could take a pretty good hit. The operative word being – if.
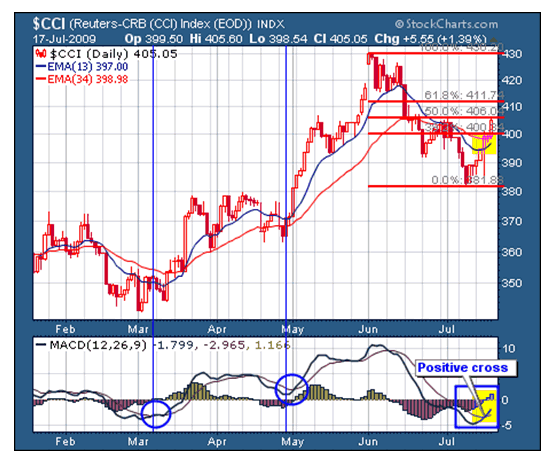
The chart below shows the CCI has rallied back to its 50% retracement level. MACD has put in a positive crossover, which is bullish. Notice the price action after the last two positive MACD crosses: both led to strong rallies.
The histograms have entered positive territory as well. These are good signs. The 13/34 ema’s have not put in a positive crossover, which would give a short term buy signal.
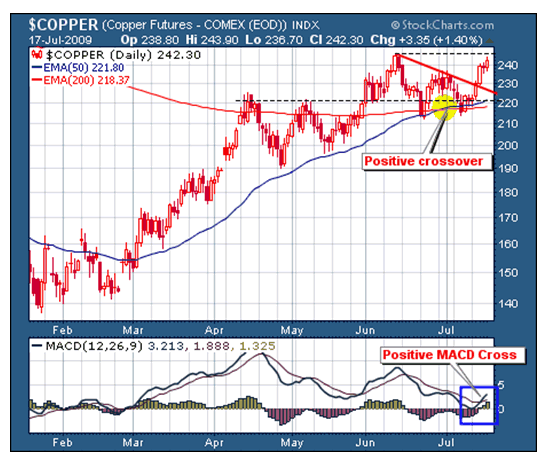
Copper is one of the leaders in the commodity complex. Note that it is running into overhead resistance. MACD has made a positive crossover AND is above the zero line. The 50/200 ema’s have made a bullish crossover.
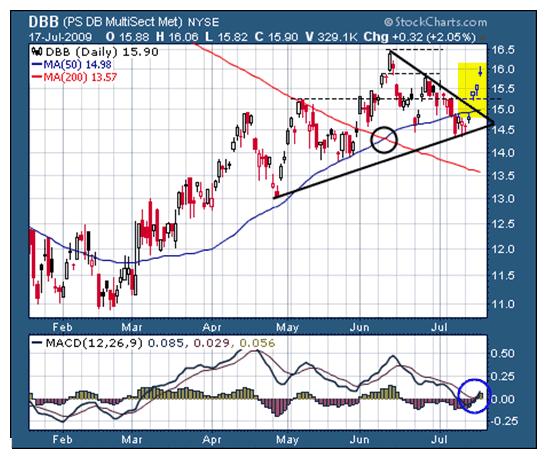
Next up are the metals, as represented by the DBB index. The index has been rallying strongly and MACD has a made a positive crossover, while also rising above the zero line – showing more positive strength.
Note the two gaps in the recent rally, which may need to be filled. Also, the 200 dma is still falling.
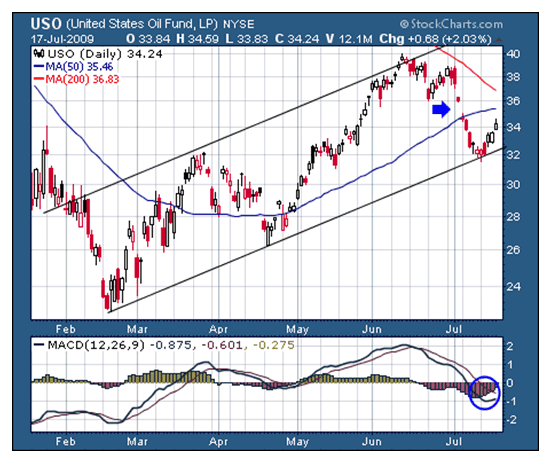
Oil (USO) is starting to come back to life. Much depends on the direction of the dollar.
Gold
Gold had a good week, closing up 2.67%, at $934.20 (continuous contract). It is fast approaching important overhead resistance at 942 and then again at 947-949. The latter is crucial to signal a sustainable move up towards the $1000.00 level. MACD & ROC have made positive crossovers. RSI is starting to curl over, however. The dollar looms large.
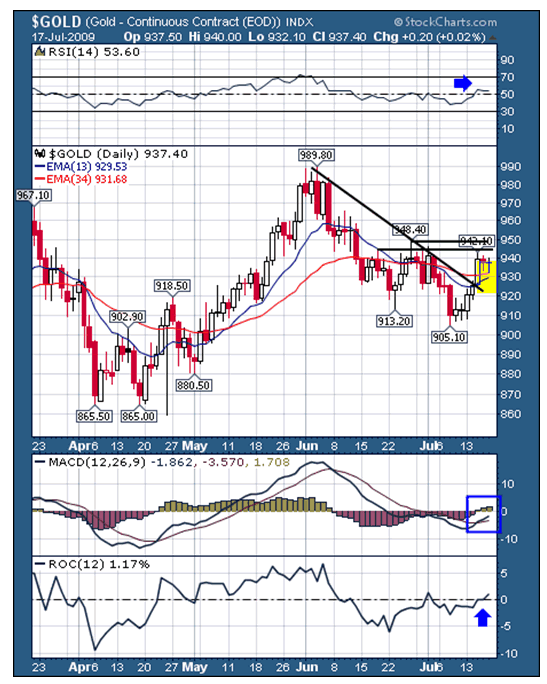
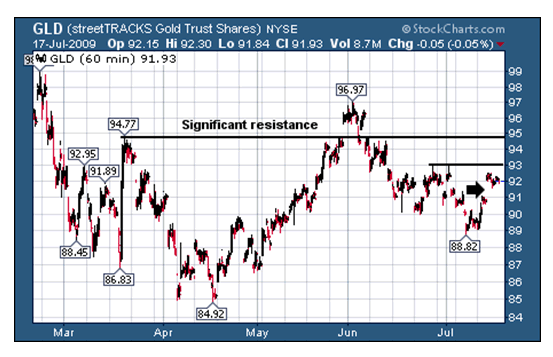
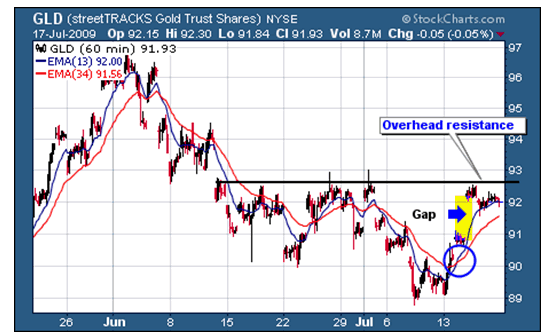
The chart above shows the crucial 947 area going back to March. Below the 60 minute chart shows short term resistance directly above. A short term buy signal occurred several days ago (blue circle).
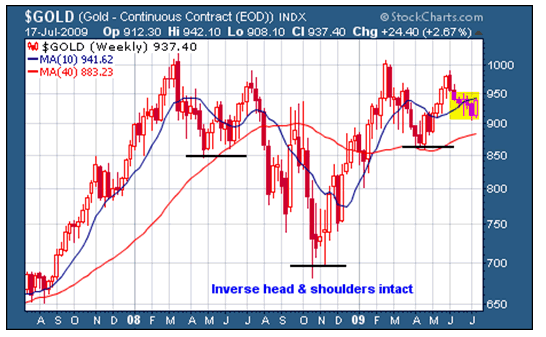
Next up is the weekly chart of gold. It shows that the inverse head and shoulders formation is still intact.
Price needs to break above the neckline on expanding volume to signal the next major move in the gold bull.
Both moving averages are headed up with price testing the 50 dma (941.62).
The above is an excerpt from the full market wrap report (41 pgs) available only at the Honest Money Gold & Silver Report website. Stop by and check out our recent calls on the downturn in the stock and commodity markets and our short position in the S&P that has been performing quite well. We were fortunate to sell our commodity stocks before the correction set in. See what stocks are on our stock watch list and in the model portfolio. A free trial subscription is available by emailing your request to: dvg6@comcast.net.
A copy of the new book: Honest Moneyis FREE with every new subscription. Stop by and check it out. You have nothing to lose and everything to gain.
Good luck. Good trading. Good health, and that’s a wrap.

Come visit our website: Honest Money Gold & Silver Report
New Book Now Available - Honest Money
Douglas V. Gnazzo
Honest Money Gold & Silver Report
About the author: Douglas V. Gnazzo writes for numerous websites and his work appears both here and abroad. Mr. Gnazzo is a listed scholar for the Foundation for the Advancement of Monetary Education (FAME).
Disclaimer: The contents of this article represent the opinions of Douglas V. Gnazzo. Nothing contained herein is intended as investment advice or recommendations for specific investment decisions, and you should not rely on it as such. Douglas V. Gnazzo is not a registered investment advisor. Information and analysis above are derived from sources and using methods believed to be reliable, but Douglas. V. Gnazzo cannot accept responsibility for any trading losses you may incur as a result of your reliance on this analysis and will not be held liable for the consequence of reliance upon any opinion or statement contained herein or any omission. Individuals should consult with their broker and personal financial advisors before engaging in any trading activities. Do your own due diligence regarding personal investment decisions. This article may contain information that is confidential and/or protected by law. The purpose of this article is intended to be used as an educational discussion of the issues involved. Douglas V. Gnazzo is not a lawyer or a legal scholar. Information and analysis derived from the quoted sources are believed to be reliable and are offered in good faith. Only a highly trained and certified and registered legal professional should be regarded as an authority on the issues involved; and all those seeking such an authoritative opinion should do their own due diligence and seek out the advice of a legal professional. Lastly Douglas V. Gnazzo believes that The United States of America is the greatest country on Earth, but that it can yet become greater. This article is written to help facilitate that greater becoming. God Bless America.
Douglas V. Gnazzo © 2009 All Rights Reserved
© 2005-2022 http://www.MarketOracle.co.uk - The Market Oracle is a FREE Daily Financial Markets Analysis & Forecasting online publication.


