Gold Bullish Inverse Head and Shoulders Pattern?
Commodities / Gold & Silver 2009 Jul 18, 2009 - 02:02 PM GMTBy: Merv_Burak
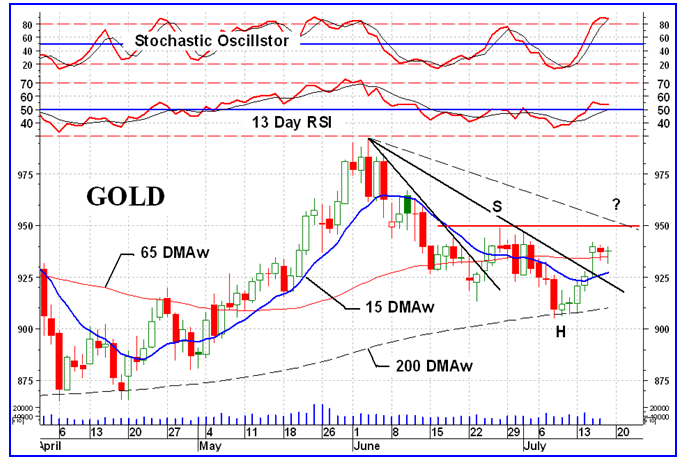
 The trend started to look good at the beginning of the week but petered out by week-end. Now, what’s next? Well, despite what I might have mentioned last week we just might be setting up a reverse head and shoulder pattern. Read about it in the short term section.
GOLD - LONG TERM
From a long term perspective nothing much has changed in the past week. The price of gold remains above its positive sloping moving average line and the momentum indicator remains in its positive zone. Although the indicator had been below its negatively sloping trigger line for the past month or so it is once more above the trigger and the trigger has now turned back to the up side. Although the daily volume is still low the volume indicator has been showing slightly better strength than either the price or momentum indicator. The long term rating remains BULLISH.
INTERMEDIATE TERM
The price of gold has been moving in a basic wide lateral path over the past several months and therefore has caused us to reverse our trend direction a few times as the price crosses above and below its moving average line. This past week the price has once more crossed the moving average line, this time to the up side. The moving average line started the week heading lower but finished the week heading upward. The momentum indicator has done a similar reversal. It is now once more in the positive zone and above its trigger line, which has turned upward. The volume indicator had dropped below its trigger line for a few weeks but is once more above the trigger and the trigger has turned positive. All signs suggest that the intermediate term rating is back to the BULLISH side.
SHORT TERM
As mentioned in the opening remark, we just might be heading towards a bullish reverse head and shoulder pattern. Don’t get too excited, however. If we do get one confirmed it is only a very short term one and the projection for the move would only be to the previous high in early June. My one emphasis last week that for a reverse head and shoulder pattern to be valid one must have had a bear trend leading into the left shoulder. As a short term pattern, we have such a short bear market move here, during the month of June. To make the pattern more probable I like to see a divergence in the momentum indicator at the head location. That we do not have here. However, a potential pattern is there just the same.
Another potential pattern can be recognized by long term readers to these commentaries. We are progressing along into a FAN PRINCIPLE set of FAN trend lines (short period variety, of course). We now have the first two FAN trend lines (the first being the bear market move into the left shoulder of the H&S pattern). I have also drawn where the third FAN trend line might be (dash line). It could coincide with the formation of the right H&S shoulder and the breaking of the (red) neckline. Although there are no clear criteria on price projections for a FAN pattern I do like to assume that a FAN reversal would take us back to the apex point of the FAN. That is where the H&S would also project.

So, where are we really, from the short term perspective? We have the price this past week moving above its short term moving average line with the line turning up towards the move. We have a momentum indicator that has moved into its positive zone, above its positive trigger line. The only cautionary indicator is the daily volume activity. That still remains low with speculators seemingly still unsure of the gold direction. However, the indicators have reversed last week’s rating and the short term is back to a BULLISH rating.
As for the immediate direction of least resistance, that seems to be turning towards the down side. The aggressive Stochastic Oscillator seems to have topped out inside its overbought zone and is in the process of turning downward. It has not yet done so and is still above its trigger line so the reversal may be another day or two away.
SILVER
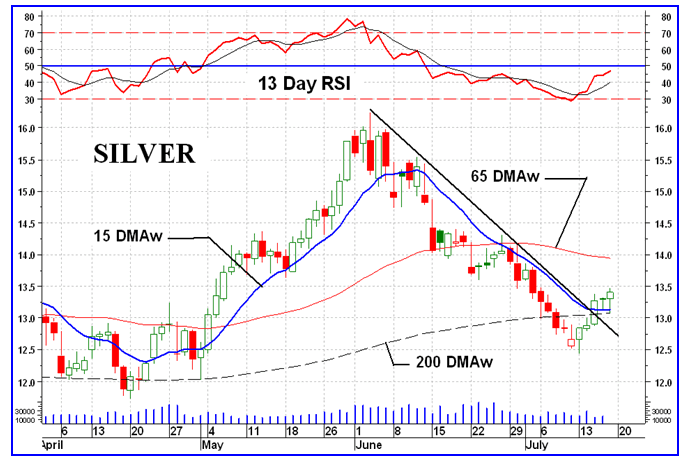
Although silver had acted better than gold over the intermediate and long term, and had beat gold in the performance game over the past week it still has some catching up to do versus recent gold action. While gold seems to have been going through a bottoming process over the past few weeks silver just headed straight down and now straight up after a sharp turn. The sharp turn has reversed the rating for silver on the short term but still has not done anything on the intermediate term. More upside would be needed to turn the intermediate term rating around.

As for a similar H&S pattern as with gold, well there is none. If one were pushing his imagination to the hilt one just might think that there was a left shoulder at the end of the week of the 22 June but that would really be pushing it.
For now we have the price of silver trading above its short term moving average line and the line slope just turned upward on Friday. The short term momentum indicator, although heading upward fast, is still slightly in the negative zone but above its positive trigger line. Despite the slight negative momentum, the sharp direction is to the up side and the short term rating is now fully BULLISH.
As for the intermediate term the price still has a way to go to breach that negatively sloping moving average line. The momentum is similarly in the negative zone but above its positive trigger line. The intermediate term rating remains BEARISH for now.
As for the long term, silver had been toying with a long term reversal but is back on track again. It is above its long term moving average line and the line is pointing upwards. The momentum indicator is moving higher and is just a hair below its neutral line but above its positive trigger line. The long term is rated as BULLISH this week.
PRECIOUS METAL STOCKS
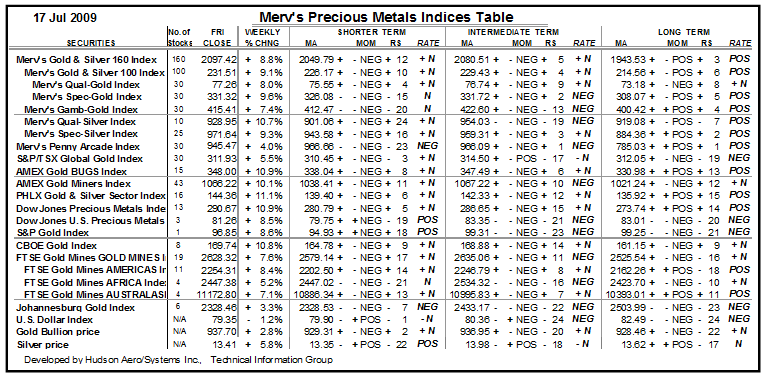
WOW! that was a good week for gold and silver stocks. The average price of a stock in the universe of 160 stocks rose 8.8% during the week. The other Merv’s Indices were a fraction of a % higher or lower, except the two gambling Indices which were on the plus side but only about half of what the other stocks were. The major North American Indices were higher mostly in the 10% to 11% area due to the highly weighted Freeport-McMoRan gaining 19% during the week. The Toronto based S&P/TSX Global Gold Index was up only half as much as the U.S. based Indices due to a 4.2% rise in the value of the Canadian $ versus the U.S. $. The move was quite general with 132 (83%) off the 160 stocks closing on the up side and only 23 (13%) closing on the down side. The best mover gained 104.8% on the week while the worst mover lost only 8.0%. This 8% loss was the only loss that was greater than 5%, all others were very minor. Despite this happy week only about 37% of the 160 stocks are classified as BULLISH (POS) on the short term and 33% BULLISH on the intermediate term. Lots of room for more upside moves.
Despite the one week move, it was only a one week move. We need more of these to set the trend back to the up side BUT we will take the upside moves when we can get them.
Precious Metals Indices Table

Well, that will be it for this week.
By Merv Burak, CMT
Hudson Aero/Systems Inc.
Technical Information Group
for Merv's Precious Metals Central
For DAILY Uranium stock commentary and WEEKLY Uranium market update check out my new Technically Uranium with Merv blog at http://techuranium.blogspot.com .
During the day Merv practices his engineering profession as a Consulting Aerospace Engineer. Once the sun goes down and night descends upon the earth Merv dons his other hat as a Chartered Market Technician ( CMT ) and tries to decipher what's going on in the securities markets. As an underground surveyor in the gold mines of Canada 's Northwest Territories in his youth, Merv has a soft spot for the gold industry and has developed several Gold Indices reflecting different aspects of the industry. As a basically lazy individual Merv's driving focus is to KEEP IT SIMPLE .
To find out more about Merv's various Gold Indices and component stocks, please visit http://preciousmetalscentral.com . There you will find samples of the Indices and their component stocks plus other publications of interest to gold investors.
Before you invest, Always check your market timing with a Qualified Professional Market Technician
Merv Burak Archive |
© 2005-2022 http://www.MarketOracle.co.uk - The Market Oracle is a FREE Daily Financial Markets Analysis & Forecasting online publication.


