


Background Info on Leading Bond Market ETFs
Interest-Rates / Exchange Traded Funds Jul 16, 2009 - 12:22 PM GMTBy: Richard_Shaw

 We find that investors tend to have a clearer understanding of the portfolios behind equity funds than behind bond funds. This blog post is provided to shine some light in a comparative way on the portfolios and recent performance of several leading bond ETFs.
To be clear, we are not recommending any particular asset allocation or fund in this post — just providing background information that may be helpful in a general way.
This image presents a table listing the leading bond ETFs by asset size for key categories:
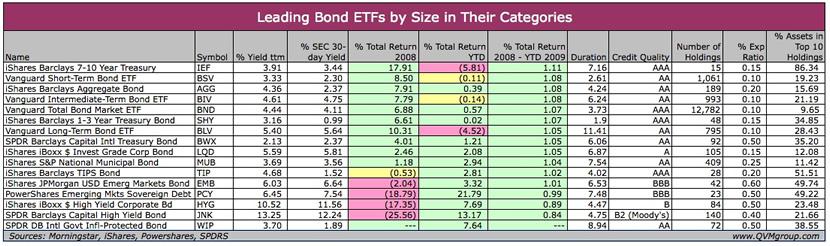
Almost all of the funds have a positive return over the period 2008 - YTD 2009. Generally, those that fell the most have risen the most. Only junk bonds have a meaningful net loss for the period.
Yields range from about 1% to over 12%. Average durations range from nearly 2 to over 11 years. Credit quality ranges from poor to excellent. There is something for everybody.
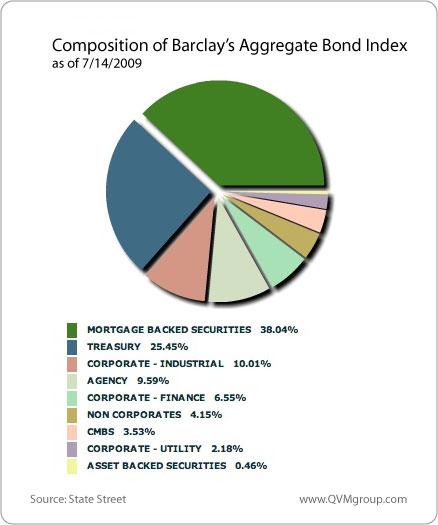
The largest portion of assets are in funds representing the Barclay’s Aggregate Bond index. That index includes all US bonds; excluding those under 12 months in maturity, inflation protected bonds, municipal bonds and convertible bonds. It includes everything else denominated in US Dollars and issued in the United States, one category of which is foreign sovereign and supranational debt issued in the US and denominated in US Dollars.
BND, from Vanguard, has the most assets (it’s a class of shares for a common asset pool for which VBMFX is also a class of shares). That pool has $57.3 billion in assets. AGG, from Barclay’s (about to be Black Rock) is the second largest ETF pool for the index, with $9.8 billion in assets. LAG (from State Street) has $0.2 billion in assets.
State Street provides this helpful graphic showing the composition of the Aggregate Bond index. We haven’t checked with State Street yet, but believe the “non-corporates” listed in their chart represents the foreign sovereign and supranational debt issued in the US and denominated in US Dollars.
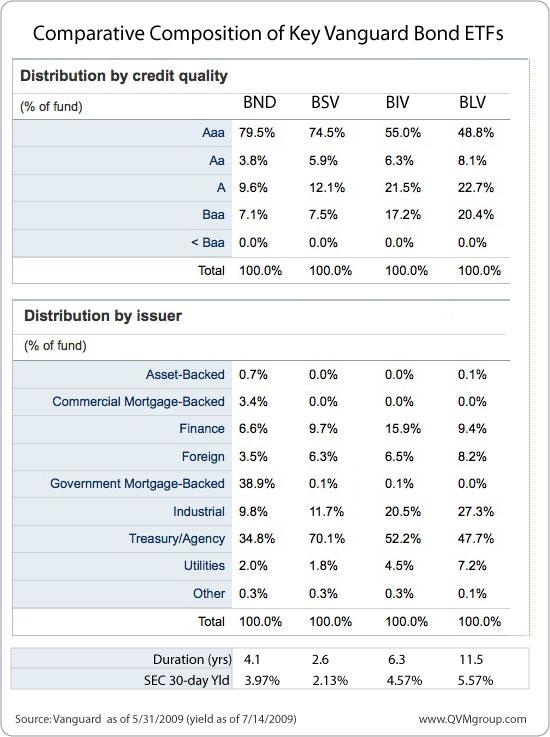
Vanguard’s version of the Barclay’s Aggregate Bond index fund is BND. The next image shows the distribution of holdings for that fund by credit quality and type of issuer, along with the same information for BSV, BIV and BLV — their short-term, intermediate-term and long-term government/credit funds.
We include BSV, BIV and BLV here, in part, because they are large funds ($11.6 billion, $8.2 billion and $2.7 billion respectively) and because it could be easy to erroneously assume that assembled together they would approximate the aggregate fund, BND. That is not the case, however, principally because BND includes various mortgage backed bonds that the other three funds do not.
Tilting Exposure:
In the same way that you might own an emerging market fund, such as VWO or EEM, and tilt the exposure toward particular countries such as China or Brazil, with a “core and satellite” approach, using FXI and EWZ; you might tilt your bond exposure by owning BND or AGG as your core, and adding other funds for Treasury (IEF), corporate (LQD), high yield (HYG or JNK) or mortgages (MBB).
Note that municipals are not included in the aggregate index, so you need separate funds for that, such as MUB, or for a more granular approach one or more of the Vanguard’s muni funds; VWSTX (short-term), VWITX (intermediate-term), VWLTX (long-term) or VWEHX (high yield).
If you want inflation protection you might add TIP. If you want foreign currency exposure through developed country sovereign debt, you might add BWX. If you want US Dollar exposure through emerging country sovereign debt, you might add PCY or EMB.
While you can tilt your exposure, you will not necessarily be diversifying asset classes by the core and satellite approach. Check the correlations before assuming you have asset class diversification.
Good fortune to you building the bond portion of your portfolio.
Securities mentioned in this article: BND, AGG, TIP, LQD, BSV, BIV, BLV, SHY, HYG, IEF, JNK, EMB, PCY, WIP, BWX, VWO, EEM FXI, EWZ, MBB, VBMFX, VWSTX, VWITX, VWLTX, VWEHX.
Disclosure: we do own some of the named securities in some accounts.
By Richard Shaw
http://www.qvmgroup.com
Richard Shaw leads the QVM team as President of QVM Group. Richard has extensive investment industry experience including serving on the board of directors of two large investment management companies, including Aberdeen Asset Management (listed London Stock Exchange) and as a charter investor and director of Lending Tree ( download short professional profile ). He provides portfolio design and management services to individual and corporate clients. He also edits the QVM investment blog. His writings are generally republished by SeekingAlpha and Reuters and are linked to sites such as Kiplinger and Yahoo Finance and other sites. He is a 1970 graduate of Dartmouth College.
Copyright 2006-2009 by QVM Group LLC All rights reserved.
Disclaimer: The above is a matter of opinion and is not intended as investment advice. Information and analysis above are derived from sources and utilizing methods believed reliable, but we cannot accept responsibility for any trading losses you may incur as a result of this analysis. Do your own due diligence.
Richard Shaw Archive |
© 2005-2022 http://www.MarketOracle.co.uk - The Market Oracle is a FREE Daily Financial Markets Analysis & Forecasting online publication.