


Goldman Flashing Warning Signal for Entire Stock Market
Stock-Markets / Stocks Bear Market Jul 15, 2009 - 06:34 AM GMTBy: Chris_Ciovacco

 Goldman Sachs (GS) is a bull market leader and a stock we like at CCM. In fact, we would consider buying it if the right entry point were to present itself. Understanding the current health of market leaders can give us some insight into the health of the entire market for risk assets. When market leaders are healthy, the market as a whole tends to be healthy. When market leaders begin to stall, it could mean trouble for the entire market.The purpose of this writing is point out some caution flags that we are observing on the daily and weekly charts of Goldman Sachs.
The technical indicator primarily used is known as the MACD-Histogram. We also point out some potentially good news on the daily chart. The potential meaning of the charts below can be explained by referencing portions of Dr. Alexander Elder’s classic book, “Trading For A Living”, which 73% of Amazon’s 201 reviewers gave a 5-star rating:
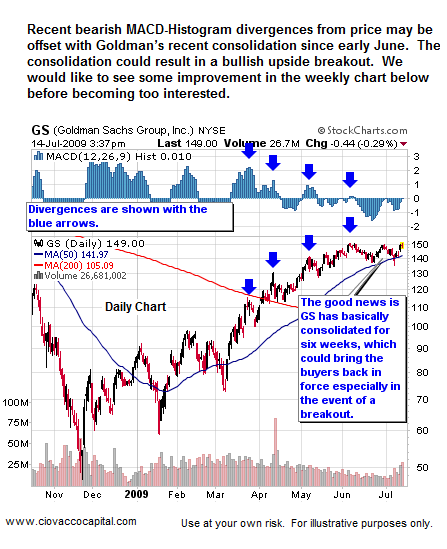
MACD-Histogram offers a deeper insight into the balance of power between the bulls and the bears...It shows not only whether bulls or bears are in control but whether they are growing stronger or weaker. It is one of the best tools available to a market technician. When prices rally to a new high, but MACD-Histogram traces a lower top, it creates a bearish divergence. A lower top in MACD Histogram shows that bulls are internally weak even though prices are higher...Bearish divergences between MACD-Histogram and prices identify weakness. (The chart below of GS is a daily chart - MACD-Histogram is at the top [see blue bars]).
Again from Dr. Elder's book:
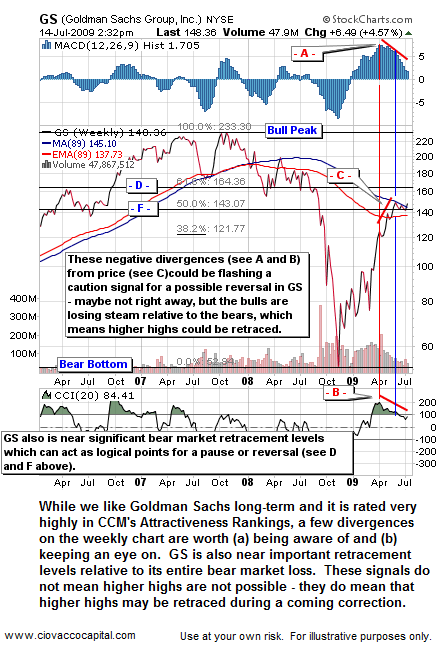
The slope of the MACD-Histogram identifies the dominant market group. A rising MACD-Histogram shows the bulls are becoming stronger. A falling MACD-Histogram shows the bears are becoming stronger. ....When the slope of the MACD-Histogram moves in the same direction as prices, the trend is safe. When the slope of the MACD-Histogram moves in a direction opposite to that of prices, the health of the trend is questioned. (The chart below of GS is a weekly chart - MACD-Histogram is at the top [see blue bars])
We want to emphasize that Dr. Elder stresses us to think in probabilities. No technical indicator or signal should be used in isolation, nor does the chart of GS above mean a reversal is imminent or even going to happen at all. The divergences have been in place for some time and GS has held up fine so far. As noted, the divergences may have already been offset with Goldman's sideways action since early June. The consolidation could give the bulls an opportunity to produce an upside breakout. If GS holds up in terms of price, then we are no worse for the wear, but understanding and being aware of the current divergence between MACD-Histogram and GS’s price can help us better wrap our arms around the potential risk-reward profile of the entire market (GS is that important to the current rally).
The fact that one of the signals is coming on a weekly chart only increases the need to be aware of it. GS is not the only stock, market, or asset class to be showing weakness in their weekly MACD-Histogram – numerous weekly charts tell us to tread with care for the short-to-intermediate term. These divergences do not necessarily put the long-term trend in jeopardy; they possibly foretell of corrections within the current trend, which in most markets is currently up.
We will see how it plays out – as long as GS holds up, there is no need to guess if a reversal is imminent - at some point a lower low would have to occur to give the signals more credibility. These signals should prepare us and cause us to pay attention. Within the context of our long-term investment horizon, the divergences by themselves are not actionable signals, although they may cause us to be careful in terms of deploying new capital.
The standoff between the bulls and bears in Goldman's stock can be seen in Tuesday's trading. GS traded over 28 million shares, a 66% increase over average trading volume. With all that activity the bulls were only able to squeak out at a narrow gain of 0.15%. Goldman will most likely have a significant move in the coming weeks one way or another – up or down. The bulls need to step it up if we are to see an upside breakout. Paying attention is worth the effort because a healthy Goldman means a healthy market - a weak Goldman would cause us to be concerned about risk assets in general.
By Chris Ciovacco
Ciovacco Capital Management
Copyright (C) 2009 Ciovacco Capital Management, LLC All Rights Reserved.
Chris Ciovacco is the Chief Investment Officer for Ciovacco Capital Management, LLC. More on the web at www.ciovaccocapital.com
Ciovacco Capital Management, LLC is an independent money management firm based in Atlanta, Georgia. As a registered investment advisor, CCM helps individual investors, large & small; achieve improved investment results via independent research and globally diversified investment portfolios. Since we are a fee-based firm, our only objective is to help you protect and grow your assets. Our long-term, theme-oriented, buy-and-hold approach allows for portfolio rebalancing from time to time to adjust to new opportunities or changing market conditions. When looking at money managers in Atlanta, take a hard look at CCM.
All material presented herein is believed to be reliable but we cannot attest to its accuracy. Investment recommendations may change and readers are urged to check with their investment counselors and tax advisors before making any investment decisions. Opinions expressed in these reports may change without prior notice. This memorandum is based on information available to the public. No representation is made that it is accurate or complete. This memorandum is not an offer to buy or sell or a solicitation of an offer to buy or sell the securities mentioned. The investments discussed or recommended in this report may be unsuitable for investors depending on their specific investment objectives and financial position. Past performance is not necessarily a guide to future performance. The price or value of the investments to which this report relates, either directly or indirectly, may fall or rise against the interest of investors. All prices and yields contained in this report are subject to change without notice. This information is based on hypothetical assumptions and is intended for illustrative purposes only. THERE ARE NO WARRANTIES, EXPRESSED OR IMPLIED, AS TO ACCURACY, COMPLETENESS, OR RESULTS OBTAINED FROM ANY INFORMATION CONTAINED IN THIS ARTICLE. PAST PERFORMANCE DOES NOT GUARANTEE FUTURE RESULTS.
Chris Ciovacco Archive |
© 2005-2022 http://www.MarketOracle.co.uk - The Market Oracle is a FREE Daily Financial Markets Analysis & Forecasting online publication.