Gold Summer Doldrums Projects Towards a Sideways Trend
Commodities / Gold & Silver 2009 Jul 13, 2009 - 03:39 PM GMTBy: Clive_Maund
 The Summer* doldrums are upon us with many investors more interested in the weather forecast than the markets. Although the Summer vacation period is often a time of drift in the markets for obvious reasons, there are exceptions like August 07, when the sub-prime crisis erupted, forcing many brokers to put down their champagne glasses and make a hasty retreat from the beach - and the lighter trading volumes at this time of year make it even easier for big money to steamroller the little guy.

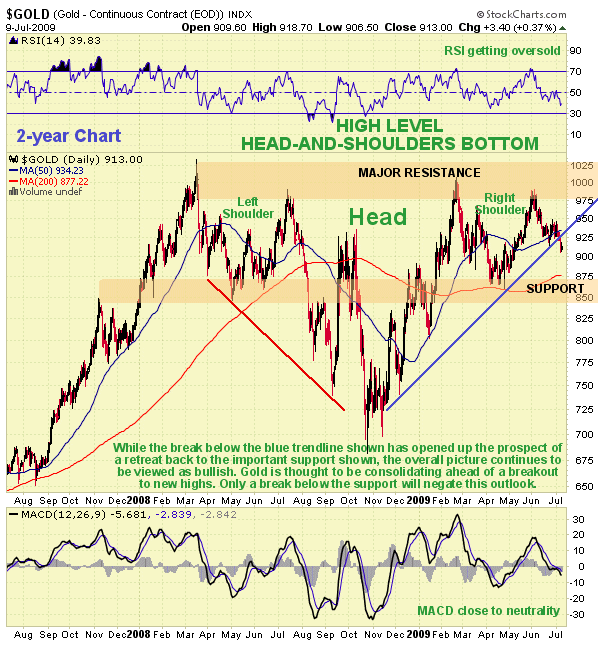
Seasonally, this is an adverse time of year for gold and silver, which tend to move sideways or down, before turning up in August, and this year is so far proving to be no exception. Many market observers, ourselves included, have pointed out the Head-and-Shoulders consolidation pattern in gold shown on our 2-year chart, that promises an eventual breakout to new highs, and a good many will therefore have found the breakdown below the blue trendline in recent days disconcerting, as it implies that the pattern may be aborting, and at the least would seem to indicate that the gold price will continue to react back to the support in the $850 - $870 area in coming weeks. However, as we will now see, there is another way of looking at this pattern.

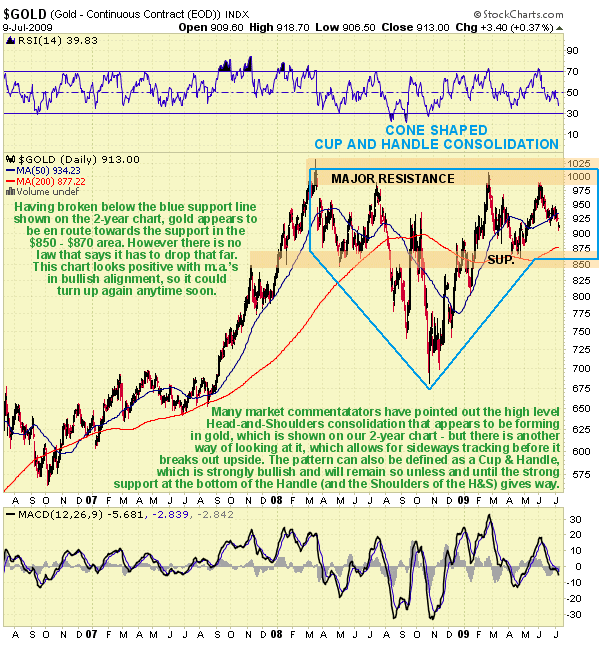
Many chart patterns are hybrids, that is while they can be defined either as one thing or another, they are sometimes better described as a cross between two (and sometimes more) patterns. Such is the case with gold, for as we can see on its 3-year chart, the pattern that has developed from the high in March of last year can be described as a cone shaped high level Cup and Handle consolidation pattern, it differing from the normal Cup and Handle in that the Cup takes the form of a V pattern rather than the usual bowl. This is a very important observation for while those who have only seen the Head-and-Shoulders pattern will be growing concerned and maybe even alarmed that gold has broken below the blue support line and looks set, at best, to mark out an extended Right Shoulder, and perhaps even break down completely, awareness of the Cup & Handle pattern means that we can be quite comfortable with gold trundling sideways for a while marking out a wide Handle between the support zone shown and the resistance approaching the highs, provided of course that the support doesn't fail.
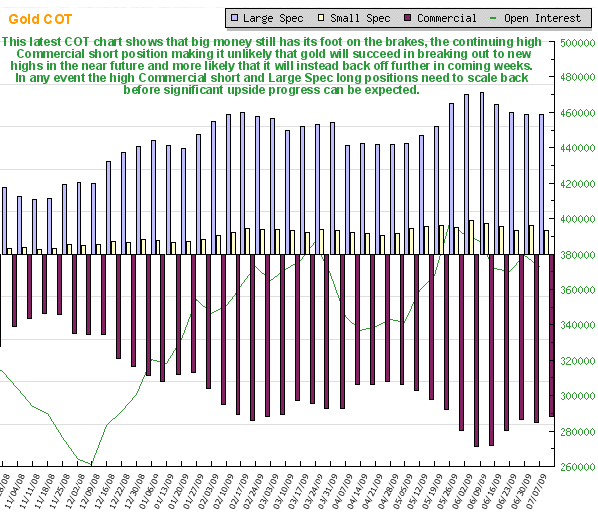
The latest gold COT chart suggests that it will be some time yet before gold can break out to a new high because the relatively high level of Commercial short and Large Spec long positions will likely need to unwind considerably before such a move becomes possible. The COT does indicate that gold is more likely to retreat further back to the support in the $850 - $870 area first.

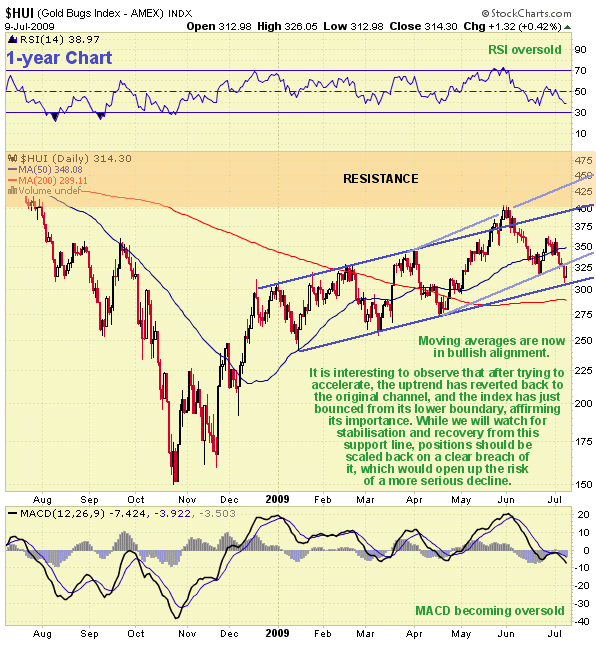
The HUI index chart is most interesting at this time, for as we can see the gentle uptrend in force from the start of the year started to accelerate as resistance was overcome, but the new steeper uptrend failed last week with the index dropping back to and bouncing off the long established uptrend, emphasizing its validity and importance. A closing breach of this channel will therefore be regarded as a trading sell signal, and holders of gold (and silver) stocks will probably want to scale back positions or protect with options in the event of such a breakdown. In the event of failure of this channel a likely downside target will be the low for the year, which occurred in January at about 240. However, we should keep in mind that should the broad stockmarket also break lower, which it is now close to doing, and drop quite steeply, we could be looking at a retreat back towards the October - November lows in the 160 - 170 area.

*Summer doldrums should be read as Winter doldrums by readers living in the southern hemisphere.
By Clive Maund
CliveMaund.com
For billing & subscription questions: subscriptions@clivemaund.com
© 2009 Clive Maund - The above represents the opinion and analysis of Mr. Maund, based on data available to him, at the time of writing. Mr. Maunds opinions are his own, and are not a recommendation or an offer to buy or sell securities. No responsibility can be accepted for losses that may result as a consequence of trading on the basis of this analysis.
Mr. Maund is an independent analyst who receives no compensation of any kind from any groups, individuals or corporations mentioned in his reports. As trading and investing in any financial markets may involve serious risk of loss, Mr. Maund recommends that you consult with a qualified investment advisor, one licensed by appropriate regulatory agencies in your legal jurisdiction and do your own due diligence and research when making any kind of a transaction with financial ramifications.
Clive Maund Archive |
© 2005-2022 http://www.MarketOracle.co.uk - The Market Oracle is a FREE Daily Financial Markets Analysis & Forecasting online publication.


