


U.S. Unemployment Claims: How Bad are the "Real" Numbers?
Economics / Recession 2008 - 2010 Jul 10, 2009 - 02:08 AM GMTBy: Mike_Shedlock

 As noted in Continuing Claims Soar by 159,000 to New Record the record continuing claims number is dramatically understated by over 2.5 million. Charts of what is really happening are shown below but first let's recap the data as reported by the Department of Labor.
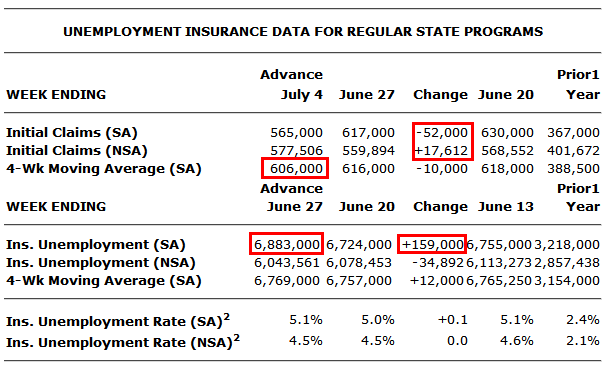
Here is a chart from Department of Labor Weekly Claims Report.
Weekly Claims
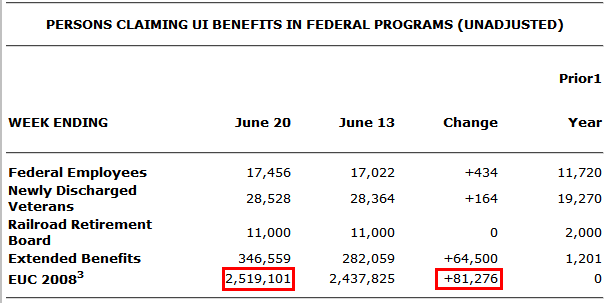
Emergency Unemployment Compensation
The continuing claims number that mainsteam media focuses on is 6,883,000 as boxed in red above. However, that number ignores extended benefits from the Emergency Unemployment Compensation (EUC) program.
Those on extended benefits are not counted in the continuing claims numbers.
Inquiring minds may wish to consider the Emergency Unemployment Compensation (EUC) PDF.
EUC is a federal emergency extension that can provide up to 33 additional weeks of unemployment benefits. The first payable week was the week of July 6-12, 2008.
The original extension passed in July 2008 paid up to 13 weeks of additional benefits. Effective November 23, 2008, we can pay up to 7 additional weeks of benefits.
Effective December 7, 2008, we can pay up to another 13 weeks of benefits.
Adding 2.519 million from the above chart to 6.883 million from the second chart the current real total (assuming nothing else is missing) the current number receiving unemployment benefits is 9.4 million.
I am unsure how Federal Employees, Newly discharged Veterans, the Railroad Retirement Borad, and especially the 346,559 Extended Benefit numbers fit into the EUC 2008 program, but I suspect all those numbers need to be added in as well, making the true count still higher.
With that backdrop, here are some custom created charts courtesy of Chris Puplava at Financial Sense, based on my request. The charts show the effect of the EUC program over time.
Thanks Chris!
Continuing Claims + EUC Extended Benefits from 2000-2009
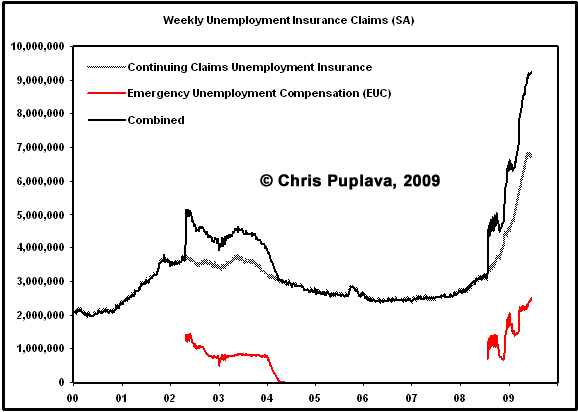
Note the dips in the EUC numbers and the corresponding dips in the total numbers. Compare to double extensions in emergency benefits:
"The original extension passed in July 2008 paid up to 13 weeks of additional benefits. Effective November 23, 2008, we can pay up to 7 additional weeks of benefits. Effective December 7, 2008, we can pay up to another 13 weeks of benefits."
Continuing Claims + EUC Extended Benefits from 1970-2009
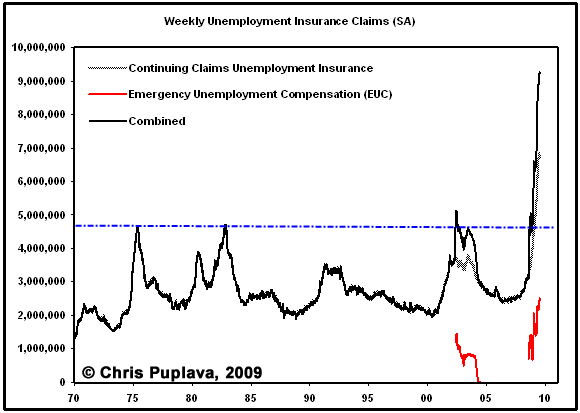
Note how the combined claims is twice as bad as the recessions is 1975 and 1982. Also note how the reported headline numbers were understated in the last recession. This is how manipulated the reporting is.
Some might claim the numbers need to bee adjusted for population growth for a valid comparison. It's a reasonable request. Chris was only able to go back to 1980 so here is what the chart looks like.
Continuing Claims + EUC Extended Benefits from 1980-2009 Population Adjusted
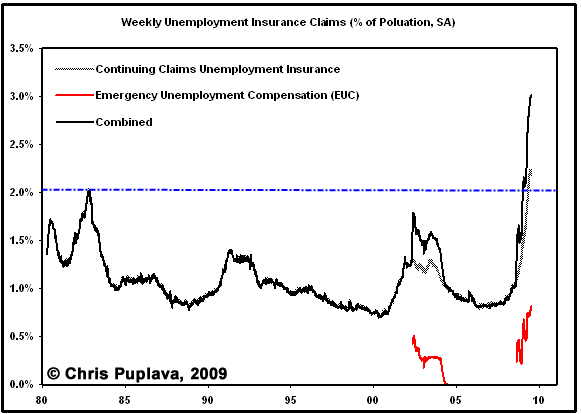
On a percentage of population basis the 2001 recession was not quite as bad as the 1982 recession, whereas the current recession is 50% worse than the 1980 recession.
Furthermore, the jobs picture is even worse than it looks. The US consumer was nowhere near as leveraged to real estate in 1980 as now. Also note that boomers are heading into retirement now, undercapitalized and looking for jobs, in effect competing against their kids and grandkids for jobs.
Look at the average age of baggers in grocery stores or greeters at Walmart. These people are not working because they want to; they are working because they have to. Demand for jobs is at an all time high while the number of available jobs and the pay scales of those jobs have both collapsed. The employment situation is not only an unmitigated disaster, things are about to get even worse with pending state cutbacks.
By Mike "Mish" Shedlock
http://globaleconomicanalysis.blogspot.com
Click Here To Scroll Thru My Recent Post List
Mike Shedlock / Mish is a registered investment advisor representative for SitkaPacific Capital Management . Sitka Pacific is an asset management firm whose goal is strong performance and low volatility, regardless of market direction.
Visit Sitka Pacific's Account Management Page to learn more about wealth management and capital preservation strategies of Sitka Pacific.
I do weekly podcasts every Thursday on HoweStreet and a brief 7 minute segment on Saturday on CKNW AM 980 in Vancouver.
When not writing about stocks or the economy I spends a great deal of time on photography and in the garden. I have over 80 magazine and book cover credits. Some of my Wisconsin and gardening images can be seen at MichaelShedlock.com .
© 2009 Mike Shedlock, All Rights Reserved
Mike Shedlock Archive |
© 2005-2022 http://www.MarketOracle.co.uk - The Market Oracle is a FREE Daily Financial Markets Analysis & Forecasting online publication.