Stealth Stocks Bull Market Summer Correction Update
Stock-Markets / Stock Index Trading Jul 08, 2009 - 12:15 AM GMTBy: Nadeem_Walayat

 The analysis of April 26th concluded that the Dow is targeting a high of 8,750 by mid May 2009 which was expected to be followed by a significant correction of 14% towards a Dow target of 7,500. The Dow hit the target on 2nd of June which was confirmed in the quick update at the time, and therefore expectations were for the significant correction to materialise.
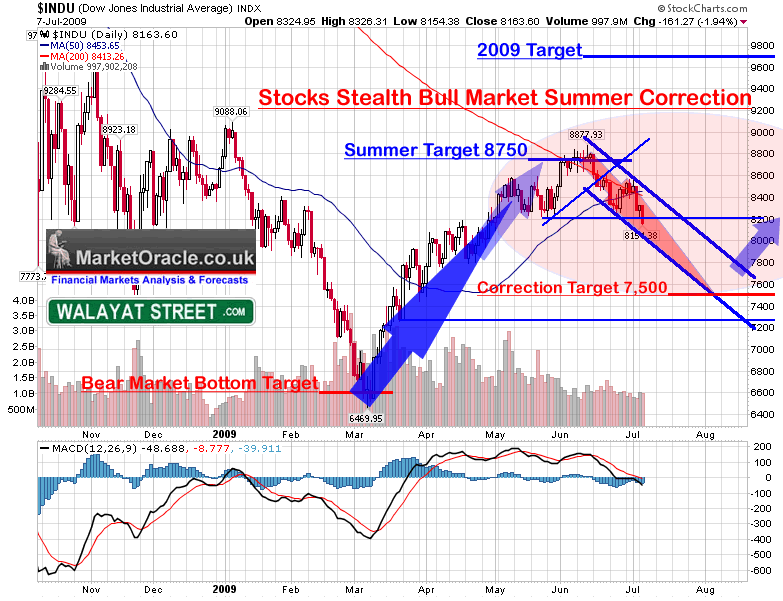
Quick Technical Analysis - The Dow spent early June distributing along 8,800, which gave plenty of time to put on short positions with tight stops. The key chart trigger was the lower high at 8,600 which targeted a break of 8,200. The pattern size is 400 points which projects to 7,800 before the next expected bounce. The overall pattern size is about 650 which projects to 8,200 minus 650 = 7,550, which is pretty close to the original projection of April 26th for the target for the Correction AFTER the peak around 8,750. The chart is also showing an head and shoulders price pattern witch the same measuring move.
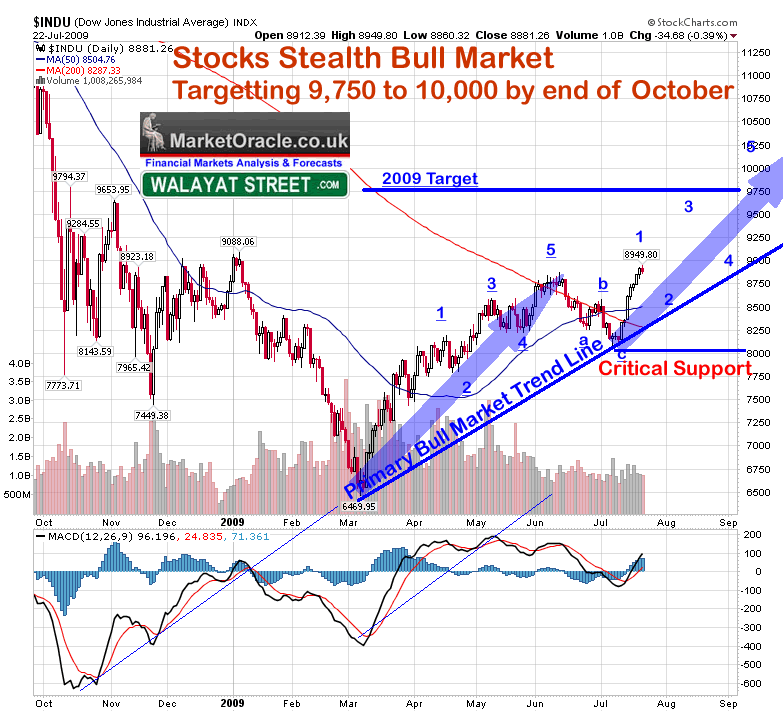
Stocks Stealth Bull Market End Probability - The probability of an end to this fledgling bull market remains very low at less than 20%, as the Dow has so far done nothing to suggest otherwise with the trend to date inline with expectations for that of a significant summer correction. The quality of the stocks bull market for the balance of the year will become clearer as the current correction unravels towards 7,500, which will enable me to generate an in depth analysis for the next 3 months or so, however existing analysis is for a 50% rally which targets Dow 9,705.
Conclusion - The Dow is still projecting towards a target of around 7,500 as indicated in the chart above, which I am sure will be taken by the perma-bears as proof that the whole move from March was just a bear market rally, JUST AT THE POINT WHERE I EXPECT THE STOCKS STEALTH BULL MARKET TO RESUME!. The in depth update to the stealth stocks bull market will follow towards the end of this month, to ensure you receive this in your email box subscribe to my always free newsletter.
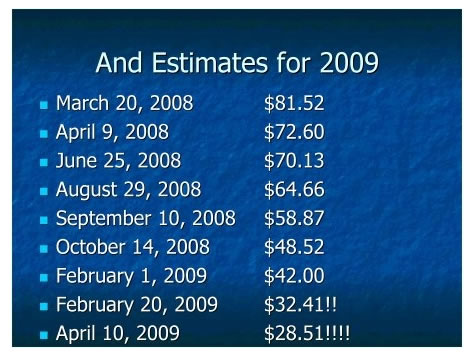
Corporate Earnings - Just as I voiced days before the stock market bottomed in March, Investors / traders will need to be on their guard against the overwhelming bearish corporate earnings forecasts for 2009, as the following chart that appears quite often illustrates -
However reminding readers of what I stated in Mid March -
Wide spread consensus today exists for SHARPLY LOWER CORPORATE EARNINGS going into 2010 THAT MUST MEAN MUCH LOWER STOCK PRICES. However this earnings analysis that is so abundant today, should have been presented OVER A YEAR AGO ! in October 2007 I.e. at or near the market peak! So that ordinary investors could actually ACT on the information. NOT NOW AT THE MARKET BOTTOM ! We are again seeing REASONS as to WHY INVESTORS should avoid investing INTO the Stealth Bull market!, precisely as we all witnessed what was effectively Bullish propaganda during the final stages of the Stocks Bull Market, so we are NOW witnessing what is effectively BEARISH propaganda in the final stages of the Bear Market. Now, don't get me wrong, I am not saying that the analysis is not genuine, what I am saying is that IT IS IRRELEVANT! As it is always much easier to build a scenario in favour of a trend that has been in force for sometime that has generated much data and analysis in support of why it exists and therefore it should continue for much longer, then to "Think Out side of the Box" to disregard bearish data that has been magnified by the growing consensus that really should have been known more than a year earlier in favour of the technical picture that as the analysis of October 2008 stated, that a. we are NOT heading for a Great Depression (as I will further elaborate upon in the Q&A below) and b. The stocks bear market HAS fulfilled its bear market objectives in terms of price and time, more than anyone could have been imagined a year ago!
Make a note of graphs like these as by year end everything has been revised higher and previous corporate earnings projections conveniently forgotten, off course by that time the market will have already moved. Remember you are trading the price and NOT the earnings forecasts which are a red herring!
Trading Signals - Whilst my analysis usually tends carry clear conclusions, however I have refrained from sharing my actual trading signals to date for a number of reasons which I have touched on in past articles. Good news, I will be sharing my actual precise position trading signals for free at WalayatStreet.com i.e. buy / sell triggers, stops, and stop and reverse (SAR) points for the Dow Jones Stock Index which I have been trading for the past 23 years. WalayatStreet.com has been under development since March 2009 and will go live this month, in the meantime WalayatStreet.com continues to point to my extensive articles archive.
Recap of the Stocks Stealth Bull Market Analysis
1. Stocks Bear market Bottom forecast - 20th Jan 2009 - Target 6,600. Warning that the bear market bottom WILL be accompanied by overwhelming and highly convincing bearish fundamentals that speculators / investors will need to ignore to prevent themselves from missing out on the BOTTOM.
2. Stocks Bear Market Target Fulfilled - 8th March 2009 - Dow 6526. Preparing for a spike higher that was expected to trigger the first of a series of buy triggers to start accumulating - As you MUST WAIT for Entry Triggers, so as to give the trades a greater probability of success, and again the message to IGNORE the media / fundamentals.
3. Stocks Stealth Bull Market Born - 15th March 2009 - Dow Bear Market Bottom confirmed on multiple buy triggers during the week - Warning to ignore the fundamentals or should I say fundamentalism, bearish commentary and in many cases double speak in favour to reacting to the ACTUAL PRICE movements.
4. Stocks Stealth Bull Market Carpet Bombs the Bears - 24th March 2009 - Short-term 33% Correction, before new stealth bull market highs. End year target 50% from 6470 i.e. 9,700.
5. Stocks Stealth Bull Market Closes above Dow 8,000 - 5th April 2009 - Psychology of investing and trading. There is no point everyone seeing the rally in a the rear view mirror if FEAR kept them from monetizing on it!
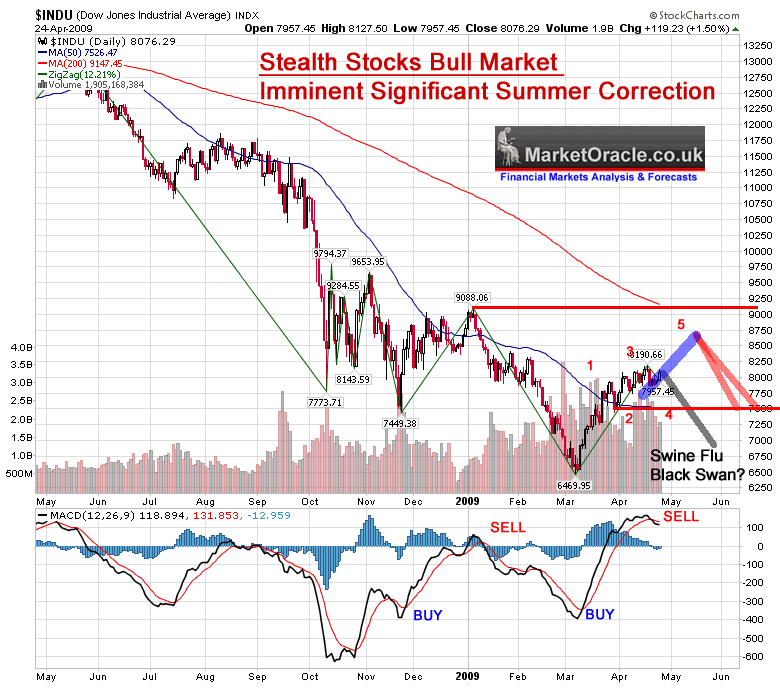
6. Stealth Stocks Bull Market, Sell in May and Go Away? - 26th April 2009 - Tradable significant correction to follow from a peak around 8,750, downtrend towards Dow 7,500 over the summer.
Your stock index trading analyst
By Nadeem Walayat
http://www.marketoracle.co.uk
Copyright © 2005-09 Marketoracle.co.uk (Market Oracle Ltd). All rights reserved.
Nadeem Walayat has over 20 years experience of trading derivatives, portfolio management and analysing the financial markets, including one of few who both anticipated and Beat the 1987 Crash. Nadeem's forward looking analysis specialises on the housing market and interest rates. Nadeem is the Editor of The Market Oracle, a FREE Daily Financial Markets Analysis & Forecasting online publication. We present in-depth analysis from over 250 experienced analysts on a range of views of the probable direction of the financial markets. Thus enabling our readers to arrive at an informed opinion on future market direction. http://www.marketoracle.co.uk
Disclaimer: The above is a matter of opinion provided for general information purposes only and is not intended as investment advice. Information and analysis above are derived from sources and utilising methods believed to be reliable, but we cannot accept responsibility for any trading losses you may incur as a result of this analysis. Individuals should consult with their personal financial advisors before engaging in any trading activities.
Nadeem Walayat Archive |
© 2005-2022 http://www.MarketOracle.co.uk - The Market Oracle is a FREE Daily Financial Markets Analysis & Forecasting online publication.
Comments
|
Ameya
09 Jul 09, 23:34 |
When will you write a book Nadeem?
Hello Nadeem I am an avid reader of you articles and am always stumped by your crystel-ball like forecasts. Will you write a book highlighting your analysis techniques? |
|
|
Nadeem_Walayat
11 Jul 09, 08:51 |
Book
The book is on hold, indefinetly as I do not have the time, however I am creating walayatstreet.com to share trading technniques and forecasting. Though forecastign skills whilst giving an edge or not necessary to trade markets as one needs to wait for the entry and exit triggers. |
|
|
John
14 Jul 09, 06:08 |
john mauldin
Hi Nadeem, I would be interested to hear your comments on this weeks john mauldin article (scary stuff). I would like to take this opportunity to thank you for your amazing articles and look forward to your trading signals while fully accepting the risk in todays volotile markets. Many thank John |
|
|
Nadeem_Walayat
14 Jul 09, 09:17 |
inflation / deflation
I will be writing on uk inflation / deflation today and comment on JM's article. The site should go online before the end of this month. Best. NW |
|
|
Tariq
16 Jul 09, 04:36 |
Dow
Hi, I noticed the Dow retraced roughly 33% from the June top before shooting upwards. Do you see this as a the second leg up for the Stealth Bull Market or do you still expect a correction towards 7500? Many thanks Tariq |
|
|
Basile
17 Jul 09, 03:49 |
the bulls are back ?
the market is bouncing back this week, in light of good results in this reporting season, especially from financials. do you really think there is still a 14% correction under way ? it looks like we could be at the base of another bull run into Q3. rgds |
|
|
Fitsum
21 Jul 09, 15:32 |
Revise for summer correction
Hi Nadeem, Can you revise your stealth bull market summer correction due to the recent rally. You have really good insight and analysis. It appears there is a double top forming. Thank you |
|
|
Nadeem_Walayat
24 Jul 09, 14:01 |
Vicious Stocks Stealth Bull Market Eats the Bears Alive!
23 Jul 2009 - Vicious Stocks Stealth Bull Market Eats the Bears Alive!, What's Next? The price action following the SELL signals earlier this month can only be described as a VICIOUS BEAR TRAP !, We got sell signals, good ones for Stock BULLs such as myself (as of Mid March 2009) it was a clear sign to get ready to accumulate more, for bears it was a sign to double up for the long awaited bear market RETEST and maybe to make back some of the money lost shorting the rally ?Even though rising prices for a bull during the stealth bull market is good, however, the vicious rally FOLLOWING Clear Technical SELL SIGNALS is something that signals alarm bells, as while it can be entertaining to gloat at the crushing of the bears, however when I look in the mirror, I have to wonder will I be next to be caught in a vicious BULL TRAP ! This is a vicious market and whether one is a bull or a bear one NEEDS to be on their guard as the consequences of getting sucked into TECHNICAL ANALYSIS, as opposed to REAL TRADING i.e. REACTING to Price movements in REAL TIME, could easily wipe traders out. More on REAL TRADING in my site walayatstreet.com which will go live once it is ready, yes people have been patiently waiting but the site cannot go live until it has the requisite articles to explain the many aspects of trading as the consequences of not doing so will result in a deluge of emails, so as with the markets PATIENCE is in order. Back to the stock market, let's dissect what happened, the precise point where the summer correction scenario abruptly terminated and where we are heading to next: Original Analysis The analysis of April 26th concluded that the Dow is targeting a high of 8,750 by mid May 2009 which was expected to be followed by a significant correction of 14% towards a Dow target of 7,500.
Dow Hits 8750 Target The Dow hit the target on 2nd of June which was confirmed in the quick update at the time, and therefore expectations were for the significant correction to materialise. Dow Gives Sell Signals During June and Early July Analysis of of 7th July - The Dow spent early June distributing along 8,800, which gave plenty of time to put on short positions with tight stops. The key chart trigger was the lower high at 8,600 which targeted a break of 8,200. The pattern size is 400 points which projects to 7,800 before the next expected bounce. The overall pattern size was about 650 which projects to 8,200 minus 650 = 7,550, which is pretty close to the original projection of April 26th for the target for the Correction AFTER the peak around 8,750. The chart also showed a head and shoulders price pattern with a similar measuring move.
The conclusion was that the Dow was still projecting towards a target of 7,500 to suck in more traders on the bear side before the resumption of the stealth stocks bull market. The Mega-trend remained for the stocks stealth bull market to move towards a target of 9,750 by the end of this year. Dow Busts TA Expectations by Triggering a Series of Buy Triggers Technical analysis was busted - There is no point in second guessing as to why the pattern changed, the fact is simple technical analysis DOES NOT WORK MOST OF THE TIME, hence one needs to always have at the FRONT of their mind, (not the back) that the MARKETS ARE MANIPULATED! As I have voiced throughout the year at key market turning points to ignore the fundamentals and listen to the price, as you are trading the price not the data! Still the price re-action observed was not something that could have been anticipated by anyone, rather only reacted to in real time trading environment. Where Next for the Stock Market Near 1000 point moves spread over just over a week makes this a great traders market but is it still a forecasters market ? I have say it is tough to call a market as vicious as this but my existing analysis as of March 09 is for a rally to 9750 for the Dow this year, the price action to date is inline with this expectation. So taking into account that this is a potentially very vicious market here is my analysis - Dow Analysis and Projection
TREND ANALYSIS - The rally off of 8,090 has been strong and powerful and could carry for some more points before correcting. The key change to the behaviour of the trend is the development of a new primary trend line that should now contain all corrections and in fact projects towards 9,750 into December 2009. Therefore implying that we could see the Dow touch this line several times during the year. The anticipated immediate correction is expected to bounce off of this line. RETRACEMENT LEVELS - The Dow Rally from 8087 has retraced 100% of the decline from 8877. The correction therefore was 8877 to 8087 or 33% which is a sign of strength. A rally of 200% of the correction projects towards a target of 9667. With intermediate term targets of 133% 9137, 150% 9272, 166% 9400 as key potential resistance areas. Therefore this is suggestive of a sustained trend along these price points, to be accompanied by corrections of between 33% to 50%. PRICE POINTS - Immediate support is at 8,600, which would represent a 50% retracement from the above 9137 % level. The heavy consolidation area between 8,600 and 8,900 is indicative of further price action in this range which is suggestive of the Dow spending further significant time in this zone for several months. This is suggestive of more sharp rallies followed by downtrends back into this price zone for some months. Key support is at 8080 a break of which would negate this scenario. ELLIOTT WAVE THEORY - Elliott wave count is straight forward and has not changed since the Stock market bottomed in March. The abc correction followed by the strong rally, is highly suggestive of an impulse wave 1, therefore implying a bull run of similar magnitude of the rally from 6470 to 8900, which projects to 10,500 that's significantly above the original target of 9,750. MACD - the MACD indicator cross has signaled a buy, which is supportive of an overall bullish trend, though not at a particularly oversold level therefore implying that the trend will be more volatile and laboured than that of the rally from 6470 to 8900. As well as signaling that the eventual peak may set the market up for a more significant decline. CYCLES - The bull market is suggestive of a 3 months up, 1 month down overall cycle pattern, this suggests a target of late October for the rally peak before a more significant correction takes place. SEASONAL TREND - The seasonal trend should be for stocks to decline into early September, therefore this is contrary to the building scenario. FUNDAMENTALS - People always ask reasons as to why stocks should rise, though in reality the reasons always become apparent AFTER the market has already moved, as I warned in Mid March, however I did at that time also give possible reasons, which still remain as the primary reasons for explanations of why stocks are rallying into a stealth bull market - A. The markets move ahead of the economy, whilst I don't profess to know the EXACT reasons of why they will move AHEAD until that becomes apparent AFTER the market has already moved, however I do have some reasoning in that INFLATION, Zero Interest Rates (Forcing savers / financial institutions to take risks) Quantitative Easing (money printing), and HUGE Fiscal stimulus packages that are laying all of the ground work for the next bubble regardless of how bad things appear as any outcome that prevents another Great Depression will be seen as bullish! i.e. even a low growth high inflation stagflationary environment WILL be seen as a positive outcome against the present day data that points to a collapse of global demand on a scale not seen since the Great Depression. The governments HAVE learned the lessons from the Great Depression and WILL succeed in inflating the asset prices and ignite the next perhaps even bigger bubble, meanwhile the stealth bull market will continue which by the time everyone realizes what's going on stocks will already by up by perhaps more than 50% from the low. However in the final analysis one is trading the stock market and NOT the economic data, so yes reasons can always be found, but when it comes to actual trading they are irrelevant, especially at market junctures. EARNINGS - Analysts are surprised !, earnings are surprising to the upside, the earnings 'fundamentalists' have been busy revising previous earnings forecasts that convinced many that fresh bear market lows were imminent and thus missing out on a stocks bull market that has already moved 40%!, Nevertheless its not surprising to me that earnings are surprising to the upside, expect even more 'surprises' later this year, after all where do you think all of the bailout billions have gone ? It has to go somewhere and we are seeing it the profit surprises in master market manipulators of Goldman Sachs and JP Morgan STOCKS STEALTH BULL MARKET - My last analysis in the midst of the correction stated that the probability of an end to the current fledgling bull market being at less than 20%, with the rally to date confirming that we remain in a STRONG MULTI-YEAR stocks stealth bull market. I am amazed that a 40% rally over 3 months is STILL perceived as a BEAR market rally?, what happened to the 20% rule?. MARKET MANIPULATION - The powerful rally following a HUGE technical SELL SIGNAL, is clear sign of market manipulation i.e. in terms of generating the sell signal AGAINST the bull market trend so as to PROFIT from the subsequent powerful short covering rally. Don't forget this is a BULL MARKET, All corrections are to get sucker money in on the short-side as an enable for a larger more profitable subsequent rally. CONCLUSION - My earlier fears about a bull trap appear to be unfounded, the stock chart is talking that we are in a stocks bull market, and is suggestive of a trend higher towards a 2009 target of between 9750 and 10,000, with a high probability that we may get there before the end of October!. Key danger areas for this scenario are a. for the trend line to contain corrections, and b. that 8080, MUST HOLD. To keep up to date on the state of the stealth stocks bull market, ensure your subscribed to my always free newsletter. Your stock index trading analyst. By Nadeem Walayat http://www.marketoracle.co.uk Copyright © 2005-09 Marketoracle.co.uk (Market Oracle Ltd). All rights reserved. Nadeem Walayat has over 20 years experience of trading derivatives, portfolio management and analysing the financial markets, including one of few who both anticipated and Beat the 1987 Crash. Nadeem's forward looking analysis specialises on the housing market and interest rates. Nadeem is the Editor of The Market Oracle, a FREE Daily Financial Markets Analysis & Forecasting online publication. We present in-depth analysis from over 250 experienced analysts on a range of views of the probable direction of the financial markets. Thus enabling our readers to arrive at an informed opinion on future market direction. http://www.marketoracle.co.uk Disclaimer: The above is a matter of opinion provided for general information purposes only and is not intended as investment advice. Information and analysis above are derived from sources and utilising methods believed to be reliable, but we cannot accept responsibility for any trading losses you may incur as a result of this analysis. Individuals should consult with their personal financial advisors before engaging in any trading activities.
|