Stocks Bull Market Sectors at Risk
Stock-Markets / Stocks Bull Market Jul 07, 2009 - 10:17 AM GMTBy: Guy_Lerner
 In "6 Leaders For The Next Rally Phase", I highlighted those sectors that had the potential to lead the next bull market phase if and when that comes. This group focused on new leadership such as semiconductors and airlines. It did not focus on the old leadership of the past bull market such energy, metals and financials.
One of my picks was the retail sector. It is hard to see the general market higher or the economy improving without the consumer on board. Certainly, this is a controversial pick as there are headwinds including poor wage growth, high unemployment, rising gas prices at the pump, and a need to increase savings and improve the household balance sheet.
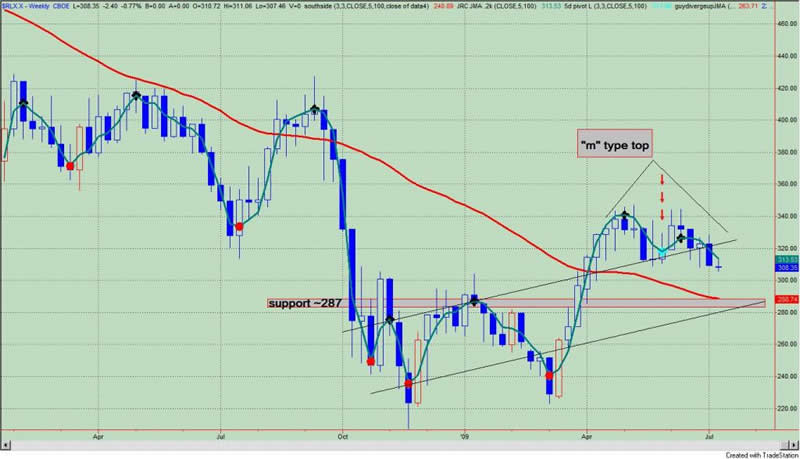
From a technical perspective, the story for the retail sector remains bullish as the "next big thing" indicator is in the zone where we would expect a secular trend change and as long as prices remained above the simple 10 month moving average. But looking at a shorter term weekly chart (see figure 1) of the S&P Retail Index (symbol: $RLX.X), I am expecting weakness that could carry prices some 10% lower. This is an "m" type top with a close below the pivot low point (identified with red arrows); prices have fallen back into the up trend channel. Significant support is at the 287 level which is the confluence of 1) the bottom channel line; 2) the 40 week moving average; and 3) the breakout from the "w" base that formed from October, 2008 to March, 2009.
Figure 1. $RLX.X/ weekly

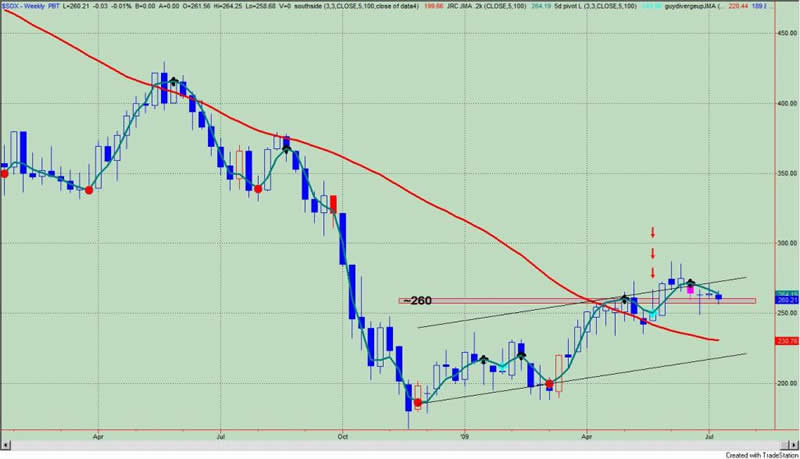
The Semiconductor Sector is another sector with leadership potential. It is tech and for the most part it sat out of the last bull market. A weekly chart of the Philadelphia Semiconductor Sector Index (symbol: $SOX) is shown in figure 2. The "SOX" is at the upper end of its trend channel, but a weekly close below 259.44 would be a close below a negative divergence bar (marked in pink) and a pivot high point; this would likely send prices lower with a test of the pivot low point at 250 (marked with red arrows). A weekly close below this level would be an "m" type top and leading prices to test the 40 week moving average and rising bottom trend channel line.
Figure 2. $SOX/ weekly

In summary, 2 sectors that could be the next bull market leaders are showing weakness. However, at this point, their leadership potential is not in jeopardy.
By Guy Lerner
http://thetechnicaltakedotcom.blogspot.com/
Guy M. Lerner, MD is the founder of ARL Advisers, LLC and managing partner of ARL Investment Partners, L.P. Dr. Lerner utilizes a research driven approach to determine those factors which lead to sustainable moves in the markets. He has developed many proprietary tools and trading models in his quest to outperform. Over the past four years, Lerner has shared his innovative approach with the readers of RealMoney.com and TheStreet.com as a featured columnist. He has been a regular guest on the Money Man Radio Show, DEX-TV, routinely published in the some of the most widely-read financial publications and has been a marquee speaker at financial seminars around the world.
© 2009 Copyright Guy Lerner - All Rights Reserved
Disclaimer: The above is a matter of opinion provided for general information purposes only and is not intended as investment advice. Information and analysis above are derived from sources and utilising methods believed to be reliable, but we cannot accept responsibility for any losses you may incur as a result of this analysis. Individuals should consult with their personal financial advisors.
Guy Lerner Archive |
© 2005-2022 http://www.MarketOracle.co.uk - The Market Oracle is a FREE Daily Financial Markets Analysis & Forecasting online publication.


