Overbought Stock Market Enters Corrective Phase Rather than an Important Top
Stock-Markets / Stock Index Trading Jul 05, 2009 - 03:26 PM GMTBy: Andre_Gratian
 Current Position of the Market
SPX: Long-term trend - Down! The very-long-term cycles have taken over and if they make their lows when expected, the bear market which started in October 2007 should continue until 2012-2014. This would imply that much lower prices lie ahead. This will not be a straight-down decline, but a series of intermediate-term rallies and declines until we have reached the low point.
SPX: Intermediate trend - The counter-trend rally which started on March 6 may be over with 956 as the high of the move. However, it could be several more weeks before we begin to see some persistent weakness manifest itself.
Analysis of the short-term trend is done on a daily basis with the help of hourly charts. It is an important adjunct to the analysis of daily and weekly charts which determines the course of longer market trends.
Daily market analysis of the short term trend is reserved for subscribers. If you would like to sign up for a FREE 4-week trial period of daily comments, please let me know at ajg@cybertrails.com .
Overview:
Thursday's sharp sell-off in the indices is bound to have the bears excited, especially considering the pattern that most indices appear to be making. After reaching 956.02 on 6/11, the SPX had its best correction since the beginning of the March rally. On the 23rd, the correction ended and an attempt at resuming the uptrend began. Last Wednesday, after having retraced .618 of its decline, the index began to pull-back and followed through sharply on the downside when a worse than expected unemployment report was announced on Thursday, dashing hopes of an imminent recovery. Does this mean that 956 is now confirmed as the high of the rally, and that we are resuming the bear market downtrend? Could wave (5) be finally underway?
With Thursday's sell-off, we appear to have completed the right shoulder of a head-and-shoulder top which, if valid, would forecast a minimum downside projection of about 820 after it breaks its neck line. Perhaps! But, as we know, most H&S patterns turn out to be false alarms. We'll have to see if this one follows through on Monday. What makes this prospect a little suspicious is that the NDX does not show a head and shoulder pattern and that index continues to handily outperform the SPX.
That does not mean that we could not have more weakness. But I believe that convincing signs are still lacking for the immediate resumption of the bear market. As we will see when we dissect the market technicals and refine our analysis, a clear picture that we have completed an intermediate top is still lacking. We could be in the process of building one, but it would require a little more time. From an intermediate point of view, the market is overbought and does not have much upside room, but there is perhaps enough for another try at the upside. The long term cycles should continue to support prices until the end of the month or a little thereafter. It's a question of whether the fundamentals will allow them to do so.
What's ahead?
Chart Pattern and Momentum
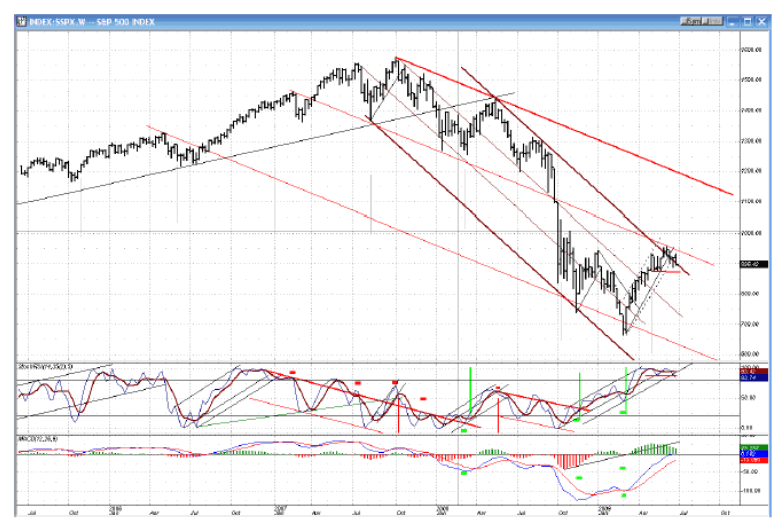
The SPX finally found some resistance at the convergence of the top of the intermediate-term bear channel and the mid-channel line of the main channel.
The past week's action could not turn the top indicator back up and it has now penetrated both its support level and its up-channel.
The MACD is just now leveling off. Depending on the market action, it could take it several more weeks before it goes negative.
The index itself has yet to give a confirmed intermediate sell. Although it has broken its trend line and come out of its channel, it has not yet broken the 880 support level. This is what will be required, to make a lower low and start a potential intermediate decline.
I have purposely erased the EW labeling from the chart. We are at a juncture which has several crossroads and I do not want to develop a mind set about which path the market will take. I want it to tell me.
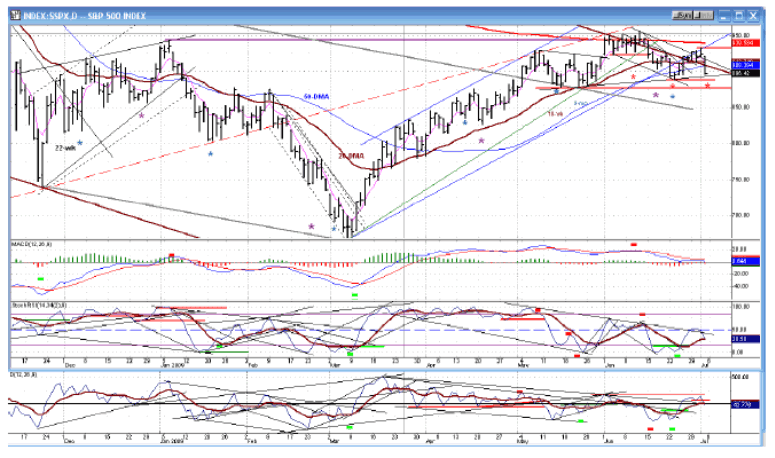
Thursday's market action did some damage to the daily chart (below). Until then, the index was trying to get back into an uptrend which had the possibility of carrying it to at least 946 if it could close decisively above 928 But it was struggling with that level, as well as with the resistance created by its former channel line. Instead, the disappointing jobs report brought about a degree of selling which took the price below the 50- DMA. Because the selling was on very light volume, it is given less credibility, and trading over the next few days will be a better gauge of what the market wants to do. For now, at least, the index has not broken an important support level. Indicators are neutral.
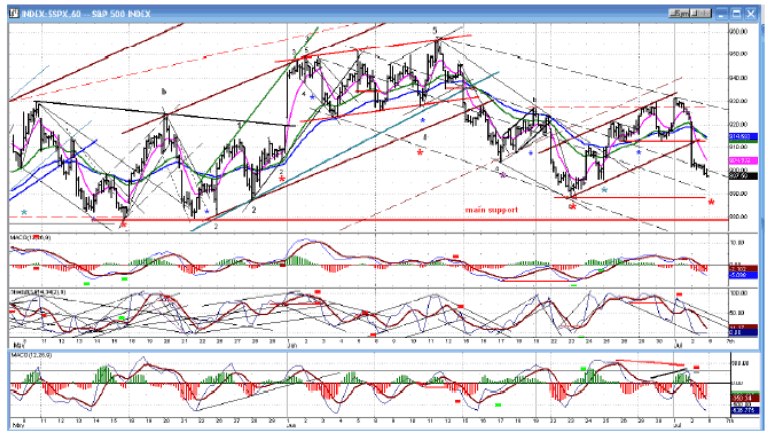
The hourly chart (above) shows that the index was vulnerable to a correction. A combination of factors made it worse than expected. The jobs report was disappointing, and this happened before a 3-day week-end with very thin trading exaggerating the price move. Nevertheless, the net result is that the Index exceeded its projection of 903 and closed on its low. There are support levels just below which must hold to prevent an outright sell signal.
The indicators are oversold, but there could be some additional price decline before they are ready to turn.
Cycles
Long-term cycles should provide some buoyancy until the end of July or early August but they could be trumped by weak economic data.
There is an 8-9 day cycle which should make its low on Monday.
The 20-wk cycle is due on 7/28. The Bradley date of 7/14 may have some effect on prices.
Projections:
When the SPX began its retracement, it had an initial projection to 903. Exceeding it is a sign of weakness. If we keep declining, 893, then 882 are the next targets.
Breaking below 879 on weakness would lead to 840-850.
Breadth
The McClellan summation index below (courtesy of StockCharts) gave us a notice of the top on June 11. Now, the RSI is oversold and more suggestive of a low than a high, but which could allow for a continuation of the decline.
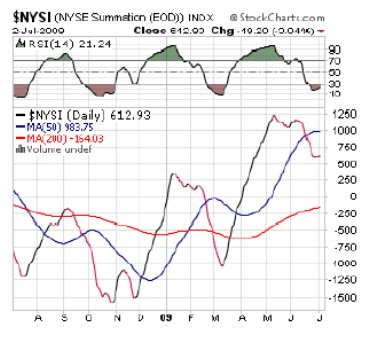
The daily breadth readings are neutral relative to price.
The hourly A/D is oversold with a small hint of positive divergence.
Market Leaders and Sentiment
Sentiment readings (courtesy of Sentimentrader) are mildly negative for the long term and mildly positive for the short term.

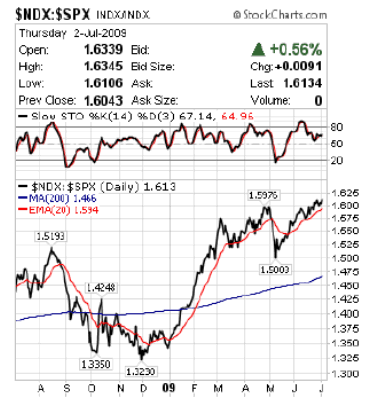
The NDX/SPX ratio is still positive and just made a new high.
Summary
Looking at all the statistics, the overall feeling is that the SPX has become overbought and is in a corrective phase rather than at an important top.
Because of the extremely low volume behind Thursday's decline, follow up data will be required to assess the significance of the move.
The following are examples of unsolicited subscriber comments:
Awesome calls on the market lately. Thank you. D M
Your daily updates have taken my trading to the next level. D
… your service has been invaluable! It's like having a good technical analyst helping me in my trading. SH
I appreciate your spot on work more than you know! M
But don't take their word for it! Find out for yourself with a FREE 4-week trial. Send an email to ajg@cybertrails.com .
By Andre Gratian
MarketTurningPoints.com
A market advisory service should be evaluated on the basis of its forecasting accuracy and cost. At $25.00 per month, this service is probably the best all-around value. Two areas of analysis that are unmatched anywhere else -- cycles (from 2.5-wk to 18-years and longer) and accurate, coordinated Point & Figure and Fibonacci projections -- are combined with other methodologies to bring you weekly reports and frequent daily updates.
“By the Law of Periodical Repetition, everything which has happened once must happen again, and again, and again -- and not capriciously, but at regular periods, and each thing in its own period, not another’s, and each obeying its own law … The same Nature which delights in periodical repetition in the sky is the Nature which orders the affairs of the earth. Let us not underrate the value of that hint.” -- Mark Twain
You may also want to visit the Market Turning Points website to familiarize yourself with my philosophy and strategy.www.marketurningpoints.com
Disclaimer - The above comments about the financial markets are based purely on what I consider to be sound technical analysis principles uncompromised by fundamental considerations. They represent my own opinion and are not meant to be construed as trading or investment advice, but are offered as an analytical point of view which might be of interest to those who follow stock market cycles and technical analysis.
Andre Gratian Archive |
© 2005-2022 http://www.MarketOracle.co.uk - The Market Oracle is a FREE Daily Financial Markets Analysis & Forecasting online publication.


