


Stock Market Bullish Investor Sentiment: There Is Always Hope
Stock-Markets / Stock Market Sentiment Jul 05, 2009 - 12:13 PM GMTBy: Guy_Lerner

 In a low volume, holiday shortened week that ended with a bang of selling pressure, the "dumb money" has yet to give up hope.
The "Dumb Money" indicator is shown in figure 1. The "Dumb Money" indicator looks for extremes in the data from 4 different groups of investors who historically have been wrong on the market: 1) Investor Intelligence; 2) Market Vane; 3) American Association of Individual Investors; and 4) the put call ratio.
Figure 1. "Dumb Money" Indicator/ weekly
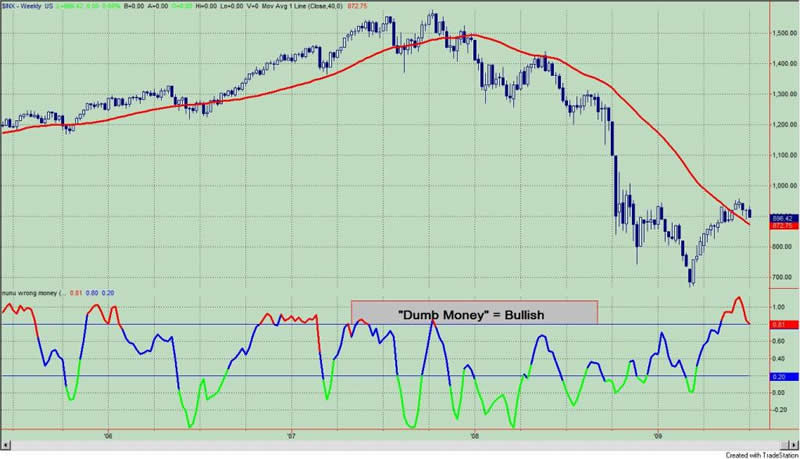
The "Dumb Money" indicator remains in the bullish extreme zone, and typically, this is a bearish signal. Since hitting bullish extremes 9 weeks ago, the S&P500 is down 3.5%, the NASDAQ 100 is up 3.7%, and the Russell 2000 is down 2.7%. Despite all the talk of "green shoots", new bull markets, and "all the bad news is priced in because the markets know all and see all", the equity markets really haven't gone anywhere over the last two months. There is always hope.
And I guess when you look at a weekly chart of the S&P500 (see figure 2), there is still hope for the bulls as prices remain above the down sloping 40 week moving average and above the key support level at 876. It really is that simple.
Figure 2. S&P500/ weekly
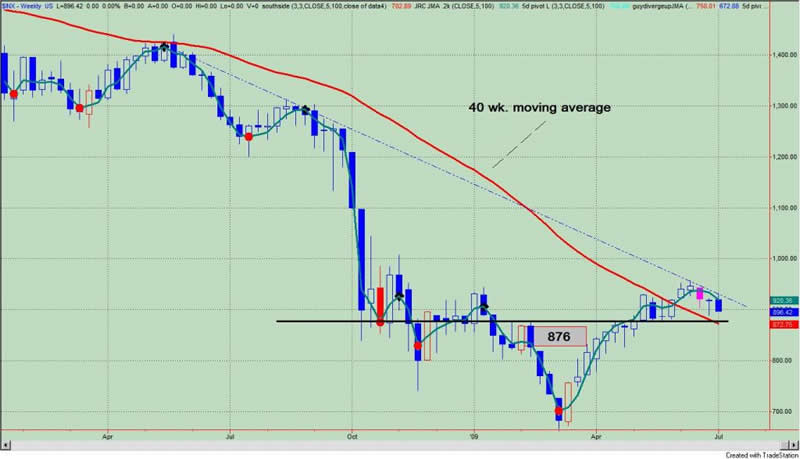
Of note, resistance is at the confluence of 1) the down sloping blue trend line; and 2) the highs of the negative divergence bar (S&P500= 942.45); this is the price bar marked in pink. In a warning sign last week, the S&P500 closed below the lows (S&P500=903.78) of this negative divergence bar suggesting weakness ahead. To read more about how the highs and lows of negative divergence bars tend to define price ranges, click on this link. Nonetheless, the real battle will be at the 876 level.
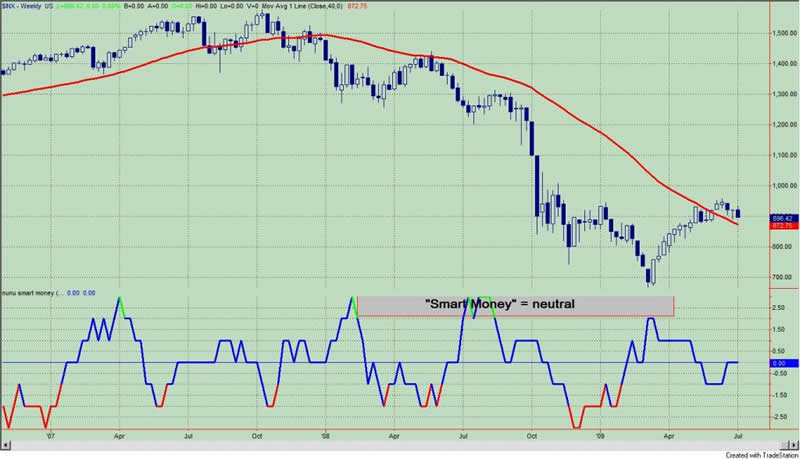
The "Smart Money" indicator is shown in figure 3. The "smart money" indicator is a composite of the following data: 1) public to specialist short ratio; 2) specialist short to total short ratio; 3) SP100 option traders. The "smart money" is neutral.
Figure 3. "Smart Money" Indicator/ weekly
By Guy Lerner
http://thetechnicaltakedotcom.blogspot.com/
Guy M. Lerner, MD is the founder of ARL Advisers, LLC and managing partner of ARL Investment Partners, L.P. Dr. Lerner utilizes a research driven approach to determine those factors which lead to sustainable moves in the markets. He has developed many proprietary tools and trading models in his quest to outperform. Over the past four years, Lerner has shared his innovative approach with the readers of RealMoney.com and TheStreet.com as a featured columnist. He has been a regular guest on the Money Man Radio Show, DEX-TV, routinely published in the some of the most widely-read financial publications and has been a marquee speaker at financial seminars around the world.
© 2009 Copyright Guy Lerner - All Rights Reserved
Disclaimer: The above is a matter of opinion provided for general information purposes only and is not intended as investment advice. Information and analysis above are derived from sources and utilising methods believed to be reliable, but we cannot accept responsibility for any losses you may incur as a result of this analysis. Individuals should consult with their personal financial advisors.
Guy Lerner Archive |
© 2005-2022 http://www.MarketOracle.co.uk - The Market Oracle is a FREE Daily Financial Markets Analysis & Forecasting online publication.