FTSE100 and Dow Jones show signs of having Peaked following US Elections
Stock-Markets / Forecasts & Technical Analysis Nov 11, 2006 - 10:28 AM GMTBy: Nadeem_Walayat
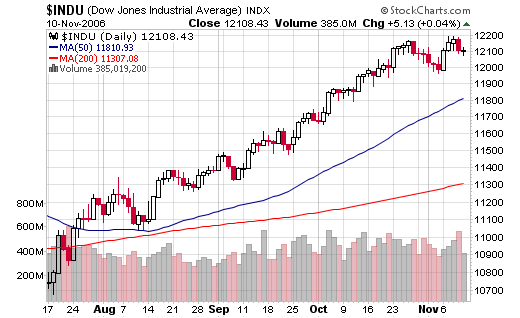
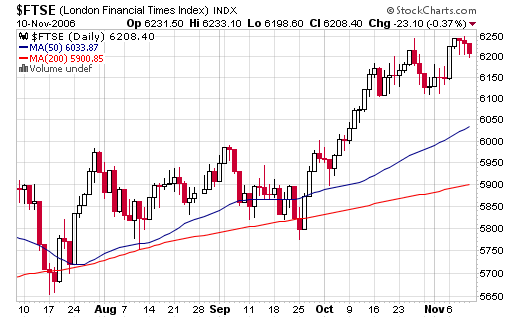
The US Mid-term election has come gone, with the stock markets having on cue rallied into the election, now post election the stock markets are starting to waver and could be heading for significant sell off during the traditionally strongest period for stock market gains. Many novices and professionals alike have taken the recent rally to beyond 12,000 in the Dow Jones and to above 6,200 in FTSE 100, as a sign of a Bull Market breakout and a signal to buy.


Seasonally, late October through to April is the the best period for world stock markets as measured by the Dow Jones Industrial Averages and the FTSE100. Add to that the 4 year US election cycle, which further reinforces the bull trends case going forward. There is a problem with this scenerio, and that is that there was no decline from September through to October.
Why would an expected market decline from Sept to Oct not occur ? Why ? Because most people were expecting it to occur in line with the seasonal expectations, as occurred last year. Similarly the US election cycle has now been well publcised, but since following the pattern on cue for much of 2006, the Dow Jones diverged from the expected price pattern from late August 06 (As per the article of 22nd October 2006 US Presidential Cycle Mid-term Election and the Stock Market).
The economic situation in the USA continues to deteriorate, as the housing market continues to fall, and growth forecasts again being revised lower. This so far has not been reflected in lowered earnings expectations going forward, which implies that the US Stock Market will be in store for earnings shocks going forward. Similarly in the UK, which following the latest base rate rise in response to inflation will slow growth and companies earnings as further rate rises are likely during 2007.
On the technical side, the new high in the Dow Jones has not been confirmed as per Dow Theory ie. the Transports have not hit new highs, and many of the other stock indices are trading well below their previous highs, so there has been little technical confirmation for the breakout in the Dow Jones.
Thus far the breakouts to new highs have not had follow through, on the contrary the picture being painted is that of failure. This now strongly suggests that the opposite to the seasonal trend is likely to occur, instead of stock market gains, we can expect losses, resulting in an aggressive decline in both the Dow Jones and the FTSE100.
A 50% retracement of the move from the June Lows to recent highs would peg an initial target for the Dow Jones of 11,450 and a target for the FTSE of 5,850.
Nadeem Walayat
Disclaimer - This Analysis / Forecast / Trade Scenerio is provided for general information purposes only and not a solicitation or recommendation to enter into any market position, and you are reminded to seek independent professional advice before entering into any investments or trading positions.
© 2005-2022 http://www.MarketOracle.co.uk - The Market Oracle is a FREE Daily Financial Markets Analysis & Forecasting online publication.


