In the Future, Interest Rates Will Soar and Consumers Will be Sore Also
Interest-Rates / International Bond Market Jul 02, 2009 - 01:01 PM GMTBy: David_Petch
 At the present, governments around the globe are printing money as if there were no tomorrow in order to try and prevent debt-laden banks from going under and trying to stimulate the fractional reserve banking system. The past 20 years of economic growth has been based on a “Pay it Forward” basis…someone gets a new couch or car and ends up paying for it over a defined period of time. The expansion of credit in turn allowed for false consumption because most people never really had the money in hand.
In the past, whenever any purchases were made, most people either saved up until they had money in hand or used “Lay Away” programs for purchase (an individual would make biweekly payments until an item was paid for in full and then taken home). As the global economy continues to shrink and get worse, the first knee-jerk reaction is to start saving, which is evident in the US as reached 6.9% year over year. When prices decline, it makes sense to save money as it does not make any sense to buy things when there is economic uncertainty.
During periods of economic contractions, the absolutely worst sectors to be in are retail or any consumer-related businesses that people do not absolutely require, such as getting manicures and pedicures, furniture, cars, etc. Areas that tend to maintain somewhat of a stable environment are Pharmaceutical (especially those that provide life-saving drugs), food and energy sectors. One of the hardest sectors that will get hit in Canada in the coming years will be the government sector. There is so much money being pumped into government up here at present that it is serving as an artificial inflator of the economy.
When the S&P eventually bottoms in late 2009/early 2010, the economic bottom should follow history and be in place 12-18 months afterwards. This suggests that mid to late 2011 should mark the bottom of the global economic recession from a bottom in residential real estate…note: commercial real estate has recently succumbed to the global recession, so it is likely the consumer will bottom before businesses do. In other words, the bottom of the economy could be flat for a subsequent 1-2 years until consumers retrench from their bunkers and again begin spending.
Analysis today will focus on the 10 Year US Treasury Index and how it should behave over the course of the next 6-12 months.
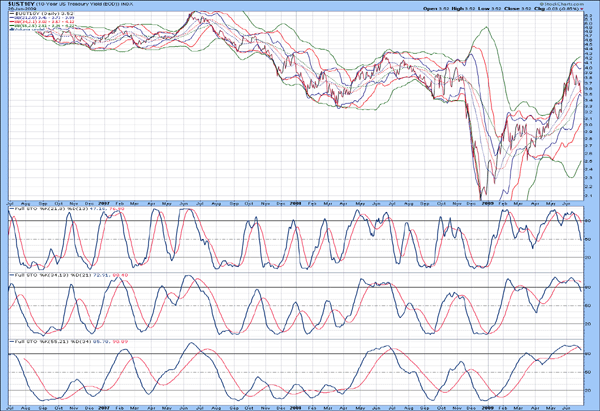
The daily chart of the 10 Year US Treasury Index is shown below, with upper Bollinger bands above the index, indicating a top was put in place. All lower Bollinger bands are rising to meet the index, suggestive the TNX just started a downward correction. Full stochastics 1, 2 and 3 are shown below in order of descent, with the %K beneath the %D in all three instances. Based upon positioning of the %K in stochastic 2, the TNX could be in a corrective decline for another 4-6 weeks. The daily chart remains a sell.
Figure 1
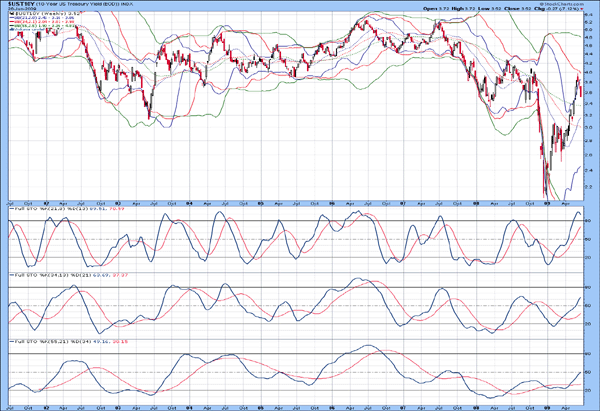
The weekly chart of the TNX is shown below, with upper and lower Bollinger band still compressing, suggestive the top in April 2008 is still being consolidated. Full stochastics 1, 2 and 3 are shown below in order of descent, with the %K above the %D in all three instances. At present, the %K in stochastic 1 has curled down, suggestive that a short-term top may be in place.
Figure 2
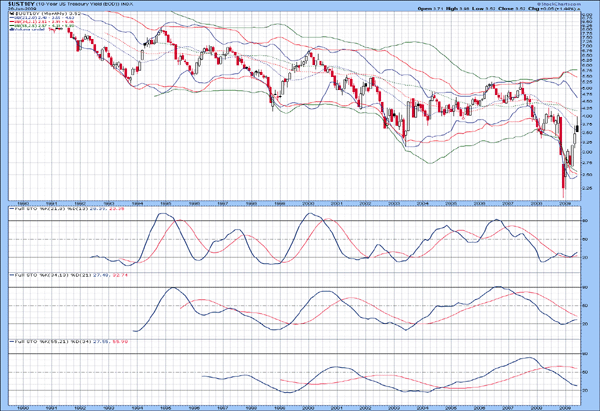
The monthly chart of the TNX is shown below, with lower Bollinger bands all beneath the index and curling up, suggestive a bottom was put in place back at the start of 2009. Upper and lower Bollinger bands have a significant spread between them, suggestive that there could be a 2-3 consolidation of rates between 3-7% before breaking higher. I must note that if the economy gets worse than expected, the TNX could pop up to 6% sooner rather than later. Full stochastics 1, 2 and 3 are shown below in order of descent, with the %K above the %D in stochastic 1. Given the low positioning of the %K for stochastics 2 and 3, the TNX will have a multi-year run when things turn up. Based upon extrapolation of the %K, it could be another 2 years before the %K crosses above the %K in stochastic 3.
Figure 3
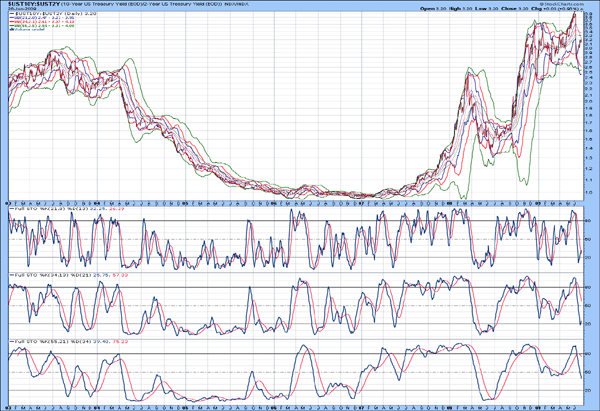
The 10 Year/2 Year US Treasury Index ratio is shown below, with lower Bollinger bands declining beneath the closing value, suggestive a bottom was put in place. Full stochastics 1, 2 and 3 are shown below in order of descent, with the %K above the %D in stochastic 1. There is likely another 3-4 weeks of consolidation before the ratio heads higher. At present, it seems like shorter term rates could rise faster than longer-term rates.
Figure 4
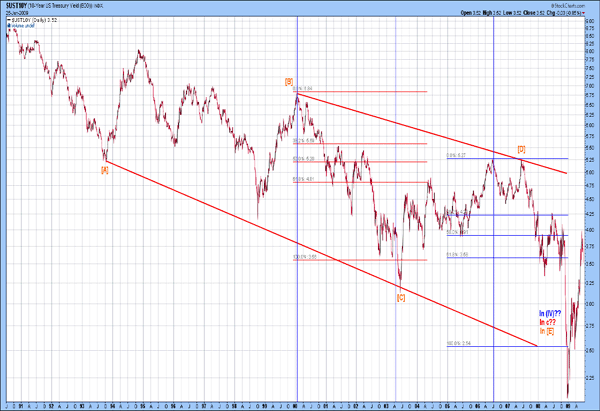
The Elliott Wave count of the TNX is shown below, with the thought pattern in wave [E], likely forming a neutral triangle…only time will tell if this is correct, but if the TNX declines to around 3 to 3.10, it could blast higher over the course of the next 8-12 months.
Figure 5
That is all for today. I will update the XOI tomorrow AM.
By David Petch
http://www.treasurechests.info
I generally try to write at least one editorial per week, although typically not as long as this one. At www.treasurechests.info , once per week (with updates if required), I track the Amex Gold BUGS Index, AMEX Oil Index, US Dollar Index, 10 Year US Treasury Index and the S&P 500 Index using various forms of technical analysis, including Elliott Wave. Captain Hook the site proprietor writes 2-3 articles per week on the “big picture” by tying in recent market action with numerous index ratios, money supply, COT positions etc. We also cover some 60 plus stocks in the precious metals, energy and base metals categories (with a focus on stocks around our provinces).
With the above being just one example of how we go about identifying value for investors, if this is the kind of analysis you are looking for we invite you to visit our site and discover more about how our service can further aid in achieving your financial goals. In this regard, whether it's top down macro-analysis designed to assist in opinion shaping and investment policy, or analysis on specific opportunities in the precious metals and energy sectors believed to possess exceptional value, like mindedly at Treasure Chests we in turn strive to provide the best value possible. So again, pay us a visit and discover why a small investment on your part could pay you handsome rewards in the not too distant future.
And of course if you have any questions, comments, or criticisms regarding the above, please feel free to drop us a line . We very much enjoy hearing from you on these items.
Disclaimer: The above is a matter of opinion and is not intended as investment advice. Information and analysis above are derived from sources and utilizing methods believed reliable, but we cannot accept responsibility for any trading losses you may incur as a result of this analysis. Comments within the text should not be construed as specific recommendations to buy or sell securities. Individuals should consult with their broker and personal financial advisors before engaging in any trading activities as we are not registered brokers or advisors. Certain statements included herein may constitute "forward-looking statements" with the meaning of certain securities legislative measures. Such forward-looking statements involve known and unknown risks, uncertainties and other factors that may cause the actual results, performance or achievements of the above mentioned companies, and / or industry results, to be materially different from any future results, performance or achievements expressed or implied by such forward-looking statements. Do your own due diligence.
Copyright © 2009 treasurechests.info Inc. All rights reserved.
Unless otherwise indicated, all materials on these pages are copyrighted by treasurechests.info Inc. No part of these pages, either text or image may be used for any purpose other than personal use. Therefore, reproduction, modification, storage in a retrieval system or retransmission, in any form or by any means, electronic, mechanical or otherwise, for reasons other than personal use, is strictly prohibited without prior written permission.
David Petch Archive |
© 2005-2022 http://www.MarketOracle.co.uk - The Market Oracle is a FREE Daily Financial Markets Analysis & Forecasting online publication.


