


Stock Market Cycle Turning Points Analysis 3rd June 2007
Stock-Markets / US Stock Markets Jun 03, 2007 - 07:53 PM GMTBy: Andre_Gratian

Current Position of the Market.
SPX: Long-Term Trend - The 12-year cycle is still in its up-phase but, as we approach its mid-point some of its dominant components are topping and could lead to a severe correction over the next few months.
SPX: Intermediate Trend - With the price reaching the preferred target area in an appropriate time frame, the rally from 3/14 should be coming to an end.
Analysis of the short-term trend is done on a daily basis with the help of hourly charts. It is an important adjunct to the analysis of daily and weekly charts which determines the course of longer market trends.
Daily market analysis of the short term trend is reserved for subscribers. If you would like to sign up for a FREE 4-week trial period of daily comments, please let me know at ajg@cybertrails.com .
Overview
In the last newsletter, I pointed out several indices that were lagging. No more! Last week, all equity indexes made new bull market highs with the S&P 500 closing at an all-time high for the first time since 2000 (although it has not yet exceeded its intra-day high). The ones that were the poorest performers, such as the Russell 2000 and the Dow Jones Transportation index had some of the best gains. This is not to say that they have really caught up with the strongest. If you compare the distance that they have risen above their February highs versus the New York Composite or the Dow Industrials, they are still relative laggards. But two weeks ago, it looked as if they were about ready to start a downtrend. This has been put off for the time being.
Market trends are normally broken down into short, intermediate and long. These are generalities, difficult to define in terms of duration. What we can say is that an uptrend remains in effect as long as it continues to make a series of higher highs and higher lows and, as simplistic as it may seem, this is one of the best ways to analyze the stock market.
If you look at a chart of the S&P 500 since October 2002, you cannot find a single intermediate term low which broke below the former one. It has been a continuous series of higher tops and bottoms, and since the bottoming of the 4-year cycle last year, upside momentum has increased substantially. The low of the 20-week cycle which occurred on March 14 and which is now 173 SPX points behind us can be considered the last intermediate bottom. At a minimum, the SPX would have to decline below 1363 to even challenge the notion that the bull market is over.
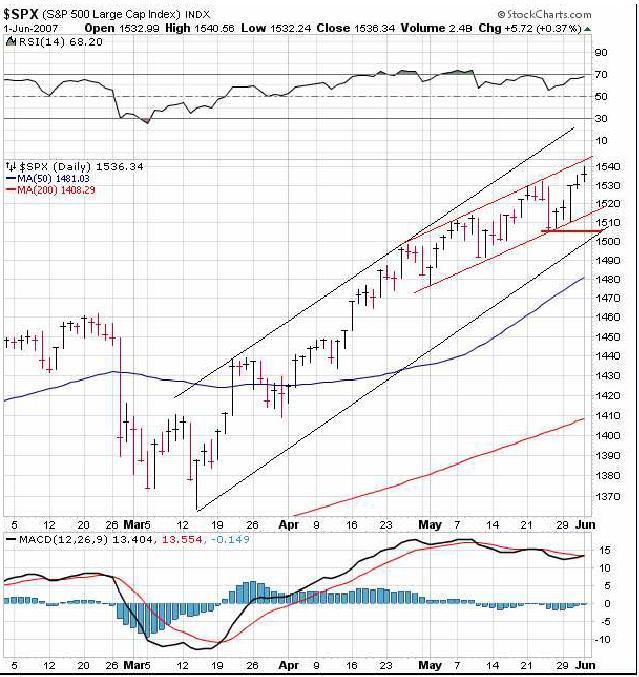
Putting an end to the intermediate term uptrend would have to be the first requirement, and this appears to be a little more feasible. The majority of minor retracements since March 14 have been caused by the bottoming of short-term cycles. The two minor cycles which were due to make their lows in the past two weeks triggered a 27-point decline followed by a 35-point rally. So the pattern of higher short-term highs and lows remains unbroken. Obviously there is still plenty of upside momentum. BUT...do we detect a little bit of deceleration in the SPX? On Friday it touched 1540.46, but closed at 1436.34, only 4 points above its former short-term top of a week ago. It seems as if the higher prices of the past two days were met with plenty of sellers, and the beginning of a rounding top is becoming more distinct and is noticeable on the chart below. Deceleration patterns are very common in the late stage of an uptrend. It's the weakening of the trend which soon leads to a reversal. This is similar to what took place prior to the February top.
The deceleration in the uptrend comes from the fact that each thrust higher is a little weaker than the last, while the retracement reaches a little closer to the former low. This pattern is currently even more evident in the NDX.
What's Ahead?
Momentum:
The deceleration pattern is reflected in the following daily chart of the SPX (courtesy of StockCharts). The main uptrend channel which is marked with black lines has now given way to another smaller channel outlined in red and rising at a less steep angle. This pattern is best observed in the momentum oscillators. In contrast to the price chart, both the RSI on top and the MACD below are now making a series of lower highs and lows. This is what is meant by negative divergence.
These are only preliminary signals which tell you to be on the alert and warning that the trend is about to come to an end. An intermediate sell signal will be given when the lower trend line of the smaller channel is penetrated to the downside, and prices continue below the point marked with the red horizontal line.
Cycles
The 6-wk and 9-wk cycles which bottomed in the past two weeks were instrumental in causing the last short-term decline. I had not expected it to meaningfully challenge the previous (10-week) low of the SPX, but the NDX did come within a few points of its former low, thereby reflecting a weaker market position. However, since it managed to make a new high on the next rally, it has preserved the integrity of its uptrend. But for how much longer?
A group of cycles which are due to bottom in 6 to 8 weeks are responsible for the current slowing and, as we draw closer, the downward pressure will intensify. Based on this expectation, I believe we should see a market reversal to finally take place within the next 2 weeks. But we have to acknowledge the fact that the market still has a lot of strength, and an intermediate top occurring so close the next intermediate low is a sign of right translation, meaning that the longer-term cycles are still in their up-phases and continue to dominate the longer trend. Which also means that labeling the coming high as the top of the bull market as some analysts are doing, is very premature.
Two Longer cycles (2-yr and 3-yr) which are sometimes responsible for bull and bear swings are in the process of topping, but it could be several months before they materially affect prices. By the time the intermediate cycles are in a position to rally later on in the Fall, the bigger cycles may begin to suppress their advance and even turn it down before new highs are reached, at least in some of the weaker indices. But I do not expect a straight path down to 2012 or 2014 as is forecasted by some of the more radical bears. I believe that, instead, we could see a prolonged period of limited range trading until early 2008, followed by weakness into the end of that year.
Projections
Several weeks ago, projections were made for a top to the intermediate trend which have now been exceeded. Since then, the SPX has created two consolidation patterns from which more accurate estimates can be made. There are two new target clusters, one between 1442 and 1445, and the other between 1455 and 1562. Each of these is capable of bringing about a final reversal.
Last Friday, the SPX traded at 1440.56 and pulled back immediately, spending the rest of the day in a lateral move. This kind of action occurring as a projection level is approximated is a sign of its validity. There is a minor cycle which should make its low on Monday or Tuesday. After that, another rally into that projection zone is expected. If the index is turned back before going beyond 1545, it will be a red alert signal and subsequent market action should be watched very carefully.
Breadth
The McClellan summation indices have been singing the same tune for several months now. Ever since they topped in December 2006, they have been making a series of undulations creating an overall sideways pattern suggesting deceleration but no real weakness.
The shorter-term McClellan oscillator has also not been very helpful in this market environment. It was in a descending pattern since late March while the market was making new highs, suggesting that breadth was weakening, normally a prelude to a market top, but last week it broke out of its downtrend and gave a buy signal. I may be wrong, but I think that this is a false signal. I have not found these indicators to be very helpful in determining trend direction of late. Perhaps it is because of the unusual market condition in which we find ourselves.
I believe that currently, the best way to use A/D data is to compare its hourly action to the hourly price chart as a means of determining the end of short-term moves.
Market leaders
A couple of weeks ago, several indices which normally lead the market by topping or bottoming ahead of the others were showing some clear signs of falling behind. But, as indicated above, several of them have since made new highs. There are now only two which have not exceeded their former bull market highs: GE and the bank sector index (BKX).
Here is a chart of 4 leaders. Even though 2 just made new highs, the lack of real strength in the past few weeks is evident.
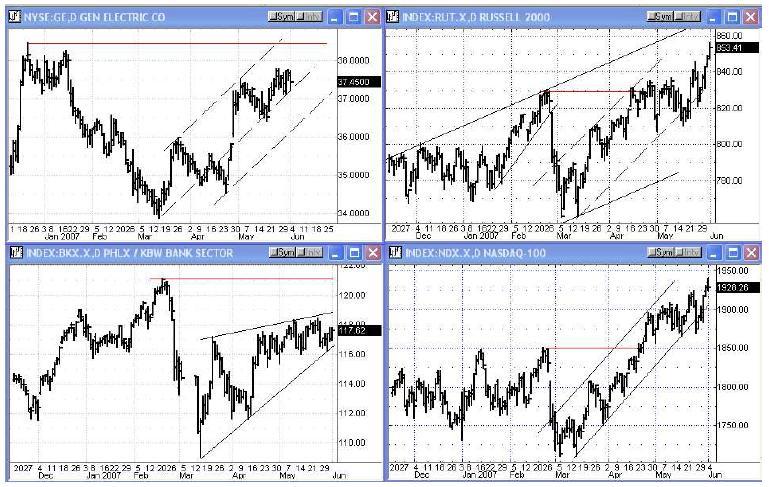
While there are signs that we are near an intermediate top, the fact that the relative performance of the leading indicators to the rest of the pack is not that pronounced may be telling us that the market may not quite ready to bring the bull to an end.
Summary
A near-term deceleration pattern in the SPX and NDX price charts is an indication that the cycles due to make their lows in the Fall are beginning to slow down their advance. I estimate that a reversal could take place within the next 2 weeks. However, because these cycles have waited so long to impact the market, it raises questions as to the nature of the coming top. It may only be the beginning of a range-bound trading pattern that will extend into early 2008, after which a severe decline could take hold.
A market advisory service should be evaluated on the basis of its forecasting accuracy and cost. At $25.00 per month, this service is probably the best all-around value. Two areas of analysis that are unmatched anywhere else -- cycles (from 2.5-wk to 18-years and longer) and accurate, coordinated Point & Figure and Fibonacci projections -- are combined with other methodologies to bring you weekly reports and frequent daily updates. The following are examples of unsolicited subscriber comments:
What is most impressive about your service is that you provide constant communication with your subscribers. I would highly recommend your service to traders. D.A.
Andre, You did it again ! Like reading the book before watching the movie! B.F.
i would like to thank you so much for all your updates / newsletters. as i am mostly a short-term trader, your work has been so helpful to me as i know exactly when to get in and out of positions. i am so glad i decided to subscribe to turning points. that was one of the best things i did ! please rest assured i shall continue being with turning points for a long while to come. thanks once again ! D.P.
But don't take their word for it! Find out for yourself with a FREE 4-week trial (above).
By Andre Gratian
MarketTurningPoints.com
If this information is of value to you, you should consider our trial subscription offer (above). Daily updates consist of a
Morning Comment, Closing Comment (which occasionally includes an updated hourly chart of the SPX to illustrate the
analysis), and at least one or more updates during the trading session whenever it is warranted by market action. These
updates discuss phase completions, give projections, potential reversal points, and whatever else may be pertinent to the
short-term trend.
“By the Law of Periodical Repetition, everything which has happened once must happen again, and again,
and again -- and not capriciously, but at regular periods, and each thing in its own period, not another’s, and
each obeying its own law … The same Nature which delights in periodical repetition in the sky is the Nature
which orders the affairs of the earth. Let us not underrate the value of that hint.” -- Mark Twain
You may also want to visit the Market Turning Points website to familiarize yourself with my philosophy and strategy.www.marketurningpoints.com
© 2005-2022 http://www.MarketOracle.co.uk - The Market Oracle is a FREE Daily Financial Markets Analysis & Forecasting online publication.