The Case Against Hyper Inflation
Economics / HyperInflation Jun 30, 2009 - 08:09 AM GMTBy: Brian_Bloom
 Here is a rather long winded, step by step, explanation of my understanding of what is happening and I have chosen to be very basic. Of course, where there is oversimplification, there are bound to be holes. But perhaps the principles will shine through.
To start with, let us imagine that the issue revolves around "where" will the hyperinflation manifest?
Imagine for the moment that only the USA was "printing" money and no other country was inflating its money supply. Theoretically, the price of goods as denominated in US$ would rise because the amount of money (in US$) is growing relative to the amount of goods available. When too much money chases too few goods, you have "demand pull" inflation.
But there is no shortage of goods, there is a surplus of goods. China and India have more goods and services to sell than the US wants to buy.
So the only reason that the price of products/services/commodities would rise in US$ is if the US$ falls in price relative to other currencies. That would give rise to "cost push" inflation - again, denominated in US$.
So, the question is: Will the US$ collapse relative to other currencies?

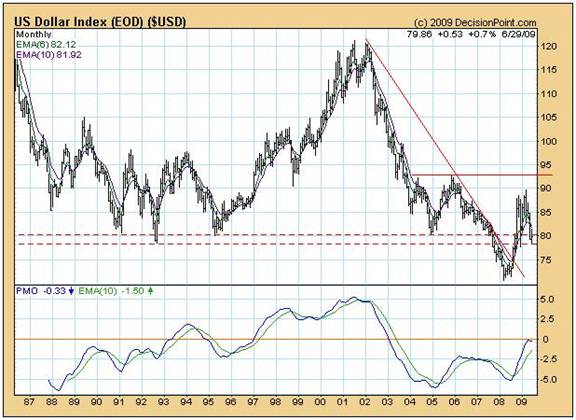
The chart above (courtesy DecisionPoint.com)shows that there is some doubt as to whether the US$ Index will collapse. We may not yet be able to determine “why” this is so, but the fact is that the oscillator is showing rising bottoms relative to falling bottoms in the Dollar Index chart. This “non-confirmation” is signaling the possibility (as opposed to probability) that the US$ Index may not collapse but may trend sideways.
Now let’s turn our attention to how the Fed might mop up liquidity.
Liquidity is defined as “cash availability”. If, for example, I own real estate, this might mean that I am rich in assets but my richness in assets might also be accompanied by the fact that I am poor in cash. I may be “illiquid”.
So “liquidity” is a function of the ease with which assets can be converted to cash.
Now, let’s image that the US Fed wants to mop up spare cash. It might issue (say) a 10 year Treasury Bond which it exchanges for cash (greenbacks). On its Balance Sheet, it has exchanged a long term “liability” for cash.
On the balance sheet of the bank or Financial Institution which paid cash for the 10 year bond, it has exchanged a short term “current” asset called cash for a long term “fixed” asset. It has reduced its cash.
There is thus less cash in the system. Of course, the institution can itself sell the 10 year bond to someone else for cash but, on balance, the total amount of cash in circulation was reduced as a result of the Fed issuing the Treasury Bond and exchanging it for cash. It has taken liquidity out of the system. It has mopped up liquidity.
Price inflation is a function of “cash” (money) inflation. It is not necessarily a function of credit inflation. If the Fed inflates the amount of credit available, but does not inflate the amount of cash available, then what happens is that the same “stock” of money may turn over faster and faster – provided the money available to be borrowed is in fact borrowed. But what if the consumer chooses not to borrow it?
Further, even if he does access the credit that has been made available, if there is sufficient availability of goods and services, the economic activity can rise without prices rising. Prices only start to rise when there are shortages of goods and services relative to availability of cash.
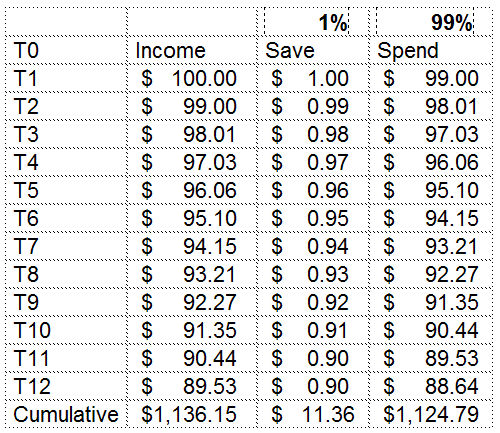
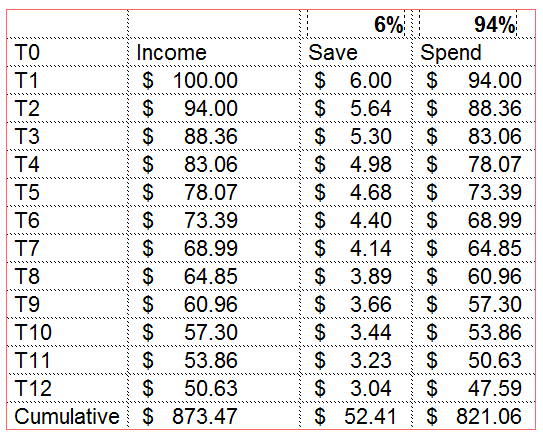
Now think of all this from the perspective of the consumer. If the consumer is not prepared to borrow the money that the Fed is making available in the form of credit and, instead, the consumer increases the percentage of income that he saves, this gives rise to a REDUCTION of the VELOCITY of money. You can see this from the two tables below. I have taken 12 time periods. In the first table I have assumed that the savings rate is 1%. In the second table I have assumed that the savings rate is 6%.
Table 1: $100 cash in the economy generates $1,136.15 cumulative income in 12 time periods assuming 1% savings

Table 2: $100 cash in the economy generates $873.47 cumulative income in 12 time periods assuming 6% savings

What happens as a result of increased savings is that overall demand for goods and services shrinks by ($1136-$873)/$1136 = 23%.
Thus, for the Fed to “manage” the economy so that the cumulative income remains at $1136.15, it will have to increase the money supply by 30% to $130
Table 3: The Fed increases the money supply
| 6% | 94% | ||
| T0 | Income | Save | Spend |
| T1 | $ 130.06 | $ 7.80 | $ 122.25 |
| T2 | $ 122.25 | $ 7.34 | $ 114.92 |
| T3 | $ 114.92 | $ 6.90 | $ 108.02 |
| T4 | $ 108.02 | $ 6.48 | $ 101.54 |
| T5 | $ 101.54 | $ 6.09 | $ 95.45 |
| T6 | $ 95.45 | $ 5.73 | $ 89.72 |
| T7 | $ 89.72 | $ 5.38 | $ 84.34 |
| T8 | $ 84.34 | $ 5.06 | $ 79.28 |
| T9 | $ 79.28 | $ 4.76 | $ 74.52 |
| T10 | $ 74.52 | $ 4.47 | $ 70.05 |
| T11 | $ 70.05 | $ 4.20 | $ 65.85 |
| T12 | $ 65.85 | $ 3.95 | $ 61.90 |
| Cumulative | $1,136.00 | $ 68.16 | $1,067.84 |
What happens here is that this 30% increase in money supply generates the same “monetary” income even as the volume of transactions is slowing.
So, in this case, there has been price inflation of 30% whilst volume has contracted by 20% - provided the Fed increases money supply.
But if the Fed “mops up” money supply by exchanging long terms treasury bonds for cash then this will have a dampening effect on the economy.
Now, if the Fed is mopping up liquidity AND the consumer is increasing his savings, what happens is this (assuming the Fed takes out $10 cash from the system)
Table 4: The Fed Reduces the money supply
| 6% | 94% | ||
| T0 | Income | Save | Spend |
| T1 | $ 90.00 | $ 5.40 | $ 84.60 |
| T2 | $ 84.60 | $ 5.08 | $ 79.52 |
| T3 | $ 79.52 | $ 4.77 | $ 74.75 |
| T4 | $ 74.75 | $ 4.49 | $ 70.27 |
| T5 | $ 70.27 | $ 4.22 | $ 66.05 |
| T6 | $ 66.05 | $ 3.96 | $ 62.09 |
| T7 | $ 62.09 | $ 3.73 | $ 58.36 |
| T8 | $ 58.36 | $ 3.50 | $ 54.86 |
| T9 | $ 54.86 | $ 3.29 | $ 51.57 |
| T10 | $ 51.57 | $ 3.09 | $ 48.48 |
| T11 | $ 48.48 | $ 2.91 | $ 45.57 |
| T12 | $ 45.57 | $ 2.73 | $ 42.83 |
| Cumulative | $ 786.12 | $ 47.17 | $ 738.95 |
Cumulative income falls from $873.47 to $786.12 and there has been a further net contraction in economic activity.
But, in “selling” 10 year Treasury Bonds for cash, the Fed has increased its liabilities. It now has an interest bearing debt on its books. It has to pay interest. The only way it can reduce its debts is to pay them off – thus injecting cash into the market. Thus, we have the paradox that if the Fed is paying down its debt it is generating an inflationary scenario (assuming the holder is US domiciled) and if it is mopping up liquidity by issuing debt it is generating a deflationary scenario.
It is only if the act of issuing more debt gives rise to more money in circulation that inflation manifests in the form of rising prices.
This brings us to the final point: As has been demonstrated above, if the Fed mops up liquidity and the consumer increases his savings, the cumulative volume of economic activity within the USA will fall. One implication of this is that fewer goods will be imported and there will be less demand for foreign currency. Fewer recipients of US dollars will be selling US dollars (by converting into their home currency) and the downward pressure on the US Dollar Index will begin to abate.
If the US Dollar does not fall, and the money supply shrinks because the Fed is mopping up liquidity, and if the volume of transactions falls, then the US might experience DEFLATION.
This deflation might eventually become a Depression if people/companies begin to fail to pay their debts as and when they fall due.
So, the bottom line is this:
The Fed is playing a very difficult game of trying to protect the US Dollar from collapse (by mopping up liquidity) and trying to prevent the US economy from collapsing (by increasing credit availability and keeping interest rates down).
That’s the theory of it all.
In fact, what we have to monitor is the money supply. The M3 number is no longer published. However, if you go to the following website, you will see what has in fact been happening to M2 money supply:
http://www.federalreserve.gov/releases/h6/Current/
M2 money supply has risen from $7,647.7 billion to $8,327.9 billion in the past 12 months. This is a rise of 8.9%. ($680 billion)
So now lets look at the tables with $7647.7 and 1% savings, and then with $8327.9 at 6.9% savings
Table 5: Money supply 12 months ago and savings rate of 1%
1% |
99% |
||
| T0 | Income | Save | Spend |
| T1 | $ 7,647.70 | $ 76.48 | $ 7,571.22 |
| T2 | $ 7,571.22 | $ 75.71 | $ 7,495.51 |
| T3 | $ 7,495.51 | $ 74.96 | $ 7,420.56 |
| T4 | $ 7,420.56 | $ 74.21 | $ 7,346.35 |
| T5 | $ 7,346.35 | $ 73.46 | $ 7,272.89 |
| T6 | $ 7,272.89 | $ 72.73 | $ 7,200.16 |
| T7 | $ 7,200.16 | $ 72.00 | $ 7,128.16 |
| T8 | $ 7,128.16 | $ 71.28 | $ 7,056.87 |
| T9 | $ 7,056.87 | $ 70.57 | $ 6,986.31 |
| T10 | $ 6,986.31 | $ 69.86 | $ 6,916.44 |
| T11 | $ 6,916.44 | $ 69.16 | $ 6,847.28 |
| T12 | $ 6,847.28 | $ 68.47 | $ 6,778.81 |
| Cumulative | $86,889.44 | $ 868.89 | $86,020.55 |
Table 6: Money supply today and future savings rate of 6%
6.9% |
93.1% |
||
| T0 | Income | Save | Spend |
| T1 | $ 8,327.90 | $ 574.63 | $ 7,753.27 |
| T2 | $ 7,753.27 | $ 534.98 | $ 7,218.30 |
| T3 | $ 7,218.30 | $ 498.06 | $ 6,720.24 |
| T4 | $ 6,720.24 | $ 463.70 | $ 6,256.54 |
| T5 | $ 6,256.54 | $ 431.70 | $ 5,824.84 |
| T6 | $ 5,824.84 | $ 401.91 | $ 5,422.92 |
| T7 | $ 5,422.92 | $ 374.18 | $ 5,048.74 |
| T8 | $ 5,048.74 | $ 348.36 | $ 4,700.38 |
| T9 | $ 4,700.38 | $ 324.33 | $ 4,376.05 |
| T10 | $ 4,376.05 | $ 301.95 | $ 4,074.11 |
| T11 | $ 4,074.11 | $ 281.11 | $ 3,792.99 |
| T12 | $ 3,792.99 | $ 261.72 | $ 3,531.28 |
| Cumulative | $69,516.29 | $4,796.62 | $64,719.66 |
Conclusion:
Because the savings rate has been rising faster than the money supply has been growing, the net effect is very likely that US economy has been contracting – both in real terms and in monetary terms. i.e. There has very likely been deflation.
It is only if the US$ falls that there will be inflation.
People like Marc Faber and Jim Sinclair – who are betting on a rise in the gold price – are betting that the dollar will collapse.
But the Fed – by mopping up liquidity – is creating a situation which is protecting the dollar. This enables the US Federal Government to continue to spend money which it borrows and which is being partially exported by the US consumer in exchange for goods and services which are being imported; and the dollars are landing up in overseas countries’ reserves.
- One projection of the US Federal Deficit for 2010 is $1.17 trillion.
- At current run rate, the US balance of payments deficit is likely to be something like $500 billion.
The difference is something like $670 billion – which happens to be almost exactly the amount by which the M2 money supply has risen.
Overall Conclusion
As a broad brush statement, M2 money supply has risen by the DIFFERENCE between the amount of money “printed” by the Fed (Debt instruments issued and exchanged for US$ held outside the USA and then sent back into the country by foreigners who have been buying the US Debt) and the amount of money sent overseas again as a result of the Trade Deficit. As can be seen in the last two tables, the net increase in money supply has been insufficient to overcome the negative impact of higher savings – and the US economy has probably been contracting.
It follows that, as long as the US Dollar holds up, according to the numbers shown above, there will NOT be hyperinflation.
It all depends on the US$.
So that’s why we have to watch the Dollar Chart. If Marc Faber and Jim Sinclair are certain that the US will experience hyperinflation, this will flow from their being “certain” that the US$ will collapse. They may well turn out to be correct, but the evidence does not (yet) support that conclusion.
By Brian Bloom
Beyond Neanderthal is a novel with a light hearted and entertaining fictional storyline; and with carefully researched, fact based themes. In Chapter 1 (written over a year ago) the current financial turmoil is anticipated. The rest of the 430 page novel focuses on the probable causes of this turmoil and what we might do to dig ourselves out of the quagmire we now find ourselves in. The core issue is “energy”, and the story leads the reader step-by-step on one possible path which might point a way forward. Gold plays a pivotal role in our future – not as a currency, but as a commodity with unique physical characteristics that can be harnessed to humanity's benefit. Until the current market collapse, there would have been many who questioned the validity of the arguments in Beyond Neanderthal. Now the evidence is too stark to ignore. This is a book that needs to be read by large numbers of people to make a difference. It can be ordered over the internet via www.beyondneanderthal.com
Copyright © 2009 Brian Bloom - All Rights Reserved
Disclaimer: The above is a matter of opinion provided for general information purposes only and is not intended as investment advice. Information and analysis above are derived from sources and utilising methods believed to be reliable, but we cannot accept responsibility for any losses you may incur as a result of this analysis. Individuals should consult with their personal financial advisors.
Brian Bloom Archive |
© 2005-2022 http://www.MarketOracle.co.uk - The Market Oracle is a FREE Daily Financial Markets Analysis & Forecasting online publication.


