


Dow Jones INDU On-Balance-Volume Stock Market Sell Signal
Stock-Markets / Stocks Bear Market Jun 27, 2009 - 09:39 AM GMTBy: Brian_Bloom

 The chart below (courtesy BigCharts.com) reflects an On Balance Volume sell signal that manifested on the Dow Jones Industrial Index Chart during this past week.
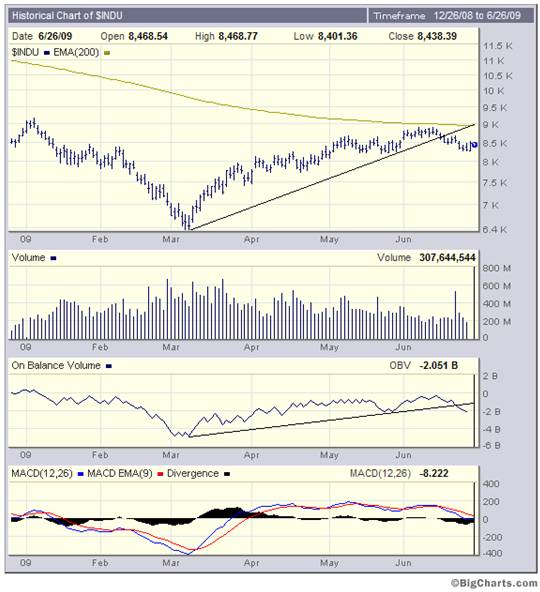
The saw-tooth pattern of descending lows and highs on the OBV chart eventually culminated in a downside penetration of the rising trend line which had its beginnings in March 2009.
This development confirms that the technical upward reaction within the Primary Bear Market has failed to overcome the resistance offered by the 200 day Moving Average line and has now drawn to a close.
Now what?
Objectively, there are two alternatives:
- A continuation of the sideways churning
- A resumption of the Primary down move
The oscillators in the chart below (courtesy sStockCharts.com) seem to be indicating a limited immediate downside potential. All are ticking up:
However, the fundamentals as reflected in the chart below (courtesy DecisionPoint.com) cannot be ignored.
Based on GAAP adjustments by Standard and Poor to underlying twelve month trailing earnings as reported by Management, the “true” Price/Earnings ratio of the S&P Industrial Index was 61.75X as at June 26th 2009. This means, that at current earnings levels, it will take an investors 61.75 years to recover their investment capital out of operating profits. Alternatively, if underlying profits (say) triple, then it will take investors over twenty years to recover their investment.
The 83 year chart below puts this into perspective.
The reader’s attention is drawn to the very first chart above. Note how the volume of shares traded had trended down since March 2009 even as prices trended up during the upward technical reaction. Essentially, what this means is that price “floated” up in the absence of selling pressure.
In this analyst’s view, the key to whether share prices are going to churn sideways or are going to resume their downward trend with a vengeance will be a function of selling pressure. If volume remains low, prices will churn sideways. If volume starts to rise, we may have the makings of a panic on our hands. Whilst logic would suggest that selling pressure “should” emerge, no one can anticipate the actual outcome with any degree of certainty. Perforce, we must wait for the market to tell us.
Conclusion
Looking forward, unless and until selling pressure emerges, the probabilities favor a sideways churning. However, any sign of rising volume which accompanies decreasing prices may be regarded as a harbinger of an impending market crash. When all is said and done, the US equity markets are more overvalued now than at any other time since 1929. It is likely to be merely a matter of time before investors finally begin to focus on this cold and unemotional fact.
By Brian Bloom
Beyond Neanderthal is a novel with a light hearted and entertaining fictional storyline; and with carefully researched, fact based themes. In Chapter 1 (written over a year ago) the current financial turmoil is anticipated. The rest of the 430 page novel focuses on the probable causes of this turmoil and what we might do to dig ourselves out of the quagmire we now find ourselves in. The core issue is “energy”, and the story leads the reader step-by-step on one possible path which might point a way forward. Gold plays a pivotal role in our future – not as a currency, but as a commodity with unique physical characteristics that can be harnessed to humanity's benefit. Until the current market collapse, there would have been many who questioned the validity of the arguments in Beyond Neanderthal. Now the evidence is too stark to ignore. This is a book that needs to be read by large numbers of people to make a difference. It can be ordered over the internet via www.beyondneanderthal.com
Copyright © 2009 Brian Bloom - All Rights Reserved
Disclaimer: The above is a matter of opinion provided for general information purposes only and is not intended as investment advice. Information and analysis above are derived from sources and utilising methods believed to be reliable, but we cannot accept responsibility for any losses you may incur as a result of this analysis. Individuals should consult with their personal financial advisors.
Brian Bloom Archive |
© 2005-2022 http://www.MarketOracle.co.uk - The Market Oracle is a FREE Daily Financial Markets Analysis & Forecasting online publication.