


The End of the Recession?
Economics / Recession 2008 - 2010 Jun 27, 2009 - 09:09 AM GMTBy: John_Mauldin

 The End of the Recession?
The New Normal Is Still In Our Future
The Hidden Problem Within Unemployment Data
Was Income Really Up?
Last week we began a series on data abuse, about how various commentators twist and torture data to make it say what they want, or fail to look at the details underneath the headlines. Predictably, there is a lot of fodder this week as we forge ahead into this ripe territory.
The headlines screamed that US income data went up unexpectedly. Green shoots were everywhere. But if you look at the actual data, you find something much different. And, I keep hearing the insistent refrain that the market is telling us that the recovery is around the corner. Well, the recovery may be, but can the market really tell us that? I have about 25 windows open in my computer, with tons of misleading data. Let's see how much we can cover in this week's letter.
But first, I want to focus your quick attention on a new "Conversation" I will have next Monday. (For those readers who are new, I have a subscription service where I hold conversations with friends on a variety of current topics. I am gratified that it's getting rave reviews.)
I have been writing about the New Normal of late, and for my next Conversation I have invited two of the sharpest analysts I know to talk about what the New Normal will look like.
What levels do we get to? What does the world economy look like? What will the path to recovery look like? And so on! David Rosenberg, former chief economist for Merrill Lynch, one of the few mainstream analysts who got it right (now with Gluskin Sheff in Toronto) and the brilliant Michael Lewitt of Harch Capital Management, someone who was writing about the credit crisis long before it happened, are both deep thinkers, and both have strong ideas about how our future will unfold. I can't wait to get them at the same table and see if we can flesh out a few concrete ideas.
And if you subscribe today, you also can get the recently released and widely praised Conversation I did with Donald Coxe and Gary Shilling on commodities and where those markets are going. That ended up as a very powerful debate, and one from which listeners said they really came away with meaty ideas.
You can subscribe now at $109 (using code JM70), before we raise the price when we add a new quarterly Conversation service with good friend and head of Stratfor, George Friedman. He gets back from Australia this week, and we will schedule a meeting soon!
And now to funny-looking data. Where to begin? There are so many targets of opportunity!
The End of the Recession?
I walked into the office yesterday evening and there was someone on CNBC talking about how the 50-day moving average of the S&P 500 rising above the 200-day moving average was telling us the market was getting ready to rise and the recovery had started. I listened to his babbling for another 2-3 minutes and couldn't take it anymore (and no, it was not my friend Larry Kudlow, who is a lot more balanced than whoever was on.)
We keep getting told that the market is telling us "something," usually that the recession is going to end. For some reason, people keep repeating the bromide that the market looks out about 6 months. To that I politely say, rubbish.
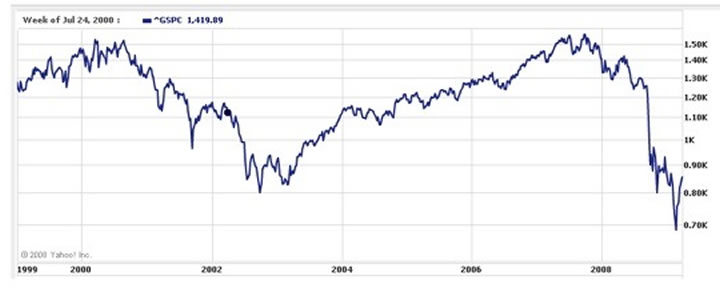
Riddle me this, Batman. Did the market see the recession in October of 2007? We were already in recession and the S&P 500 (see below) was making new highs! Where was the market prescience? Did it see the 25%+ drop in January of this year? And I could go back and cite scores of examples where the market "missed" the future turning points over the past ten decades.
What about the shibboleth that the market turns up 6 months before the end of a recession? Sometimes that is true. But does it mean anything? The same people who said it meant something last December and January are saying it means something now. But now it's June and the recovery is not here, so maybe the market wasn't telling us something in January after all.
Gentle reader, there will be a recovery. We will talk about what kind in a few pages, if we have the time. And it is (statistically speaking) likely that the markets will have turned up before the actual recovery. But does that mean anything today?
Go back to the chart above. Notice that in 2003, when the market finally turned up, we were already well out of recession. And the market had a very quick 12% or so drop while we were in recovery, while later we went on to a 90% run-up! Was the drop telling us anything, or do we explain it away?
"In the short run," St. Graham said, "the market is a voting machine. In the long run it is a weighing machine." The voting is based on current sentiment, but what the market weighs in the long run is earnings. The market tries to forecast future income streams. And it gets it wrong as often as it gets it right.
Let's look at this yet another way. This is an important concept, and it should be a component of your economic BS detector. The CNBC host talked in breathless terms about the importance of the 50-day average moving above the 200-day average. It means nothing until it means something, and we won't know what that something is for some time.
Earlier this week (Monday, I think) the 50-day average moved BELOW the 200-day average. The analysts at Bespoke Investment Group noted:
"Going back to 1928, this is the 25th time that the S&P 500 has declined through both of these levels on the same day. On page two we have provided a table showing each of these occurrences as well as the index's returns going forward. Based on those prior instances, the S&P 500's returns going forward have been notably negative. While the S&P 500 has averaged positive returns over the next week, average returns have been negative over the next month, three months, and six months." (emphasis mine)
But 33% of the time, the markets were up six months later, often by quite a bit. And sometimes down quite a bit, but on average only slightly. Which means that as a forward-looking indicator it is interesting but not anything I would put my money (or client money) on!
(I saw some reports that differed, selecting fewer such data points and suggesting that market returns were up after such an event. Logically, that can't be. Let's be generous and just assume sloppy research.)
Before major market moves down, the 50-day average will always move below the 200 average. And the reverse is also true. It is not a sign. It is just what statistically MUST happen. And sometimes they reverse themselves, and sometimes they don't. We have no way on God's green earth of knowing whether the two moves (both up and down) this week will be bullish or bearish six months from now, based simply on the moving averages crossing. You can make the data say anything you want, but you are still just guessing.
Sidebar note: Trend Following 101. I spend a lot of time analyzing trend-following money managers of one kind or another. Basically, they look at data and try to spot trends and then invest in them. A trader who is right 70% of the time is amazing and very rare. 50% is more like it for successful traders. But they have sharp risk controls that cut their losing trades and let their winning trades "ride." Being right 50% of the time can be profitable over time. (Being right 50% of the time is harder than it looks!)
But in the media you get these "analysts" who talk a good game, acting as if a 50-70% probability is something meaningful. "The market has turned. The recession is over." And they say that when we have the first balance-sheet recession in 70 years, yet they want to compare garden-variety recessions to what we have now. Again, we can only know which of the moves (above and below the 200-day moving average) will be the real "indicator" in six months. It is only an indicator today to the extent that we can drive our cars forward looking in the rear-view mirror.
The New Normal Is Still In Our Future
Now let's take that principle a little further. Last week I detailed how air, trucking, and rail shipping is down 20% year-over-year. Global trade is down about 30% in the major exporting countries (see below).
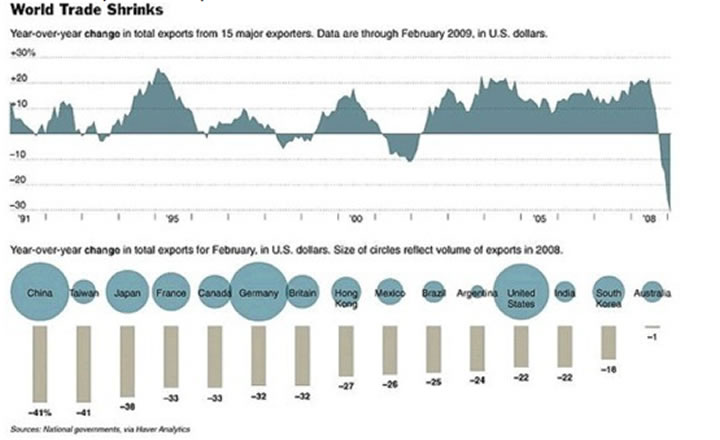
World trade shrinks : Chart 1: Year-over-year change in total exports from 15 major exporting countries (1991-02/2009) / Chart 2: Year-over-year change in exports from 15 major exporters between February 2008 and February 2009 (size of circles reflects volume of exports in 2008)
End of the world? Do we just keep falling? No. At some point, six months or a year from now, the year-over-year comparisons become easier. If you are at 100 and fall to 80, then a year later you are at 88 and voila! you have a 10% increase! And the perma-bulls will be talking it up. The fact that you are still down 12% from the peak is ignored.
The point is that we have fallen quite a bit in a lot of major categories. There is really only so much you can fall. And then when you reach that new lower level of the New Normal, you begin to rise. At some point, we will be on the path to "recovery." That does not mean that we will be back to the halcyon days of mid-2007 within a year. It just means that we have stopped falling and now have to adjust to the levels of the New Normal.
The Hidden Problem Within Unemployment Data
This is going to be most evident and painful in the unemployment numbers. Last month saw the number of unemployed rise by 345,000. What was not in the headline data was that 217,000 of those jobs were estimated from the "birth-death" ratio. The US economy creates new businesses that do not get counted in the data, so the BLS estimates what that number is, using previous data patterns. When the economy turns, it overestimates new jobs in recessions and underestimates them in recoveries. No conspiracy, it is just the best methodology we currently have.
But does anyone really think 200,000 jobs were created last month? The real number of lost jobs is worse than the headline. And next month the birth-death number will likely be over 200,000 again. Add another 100,000 or so to the headline number to get closer to reality,
Again, analysts talked about a turnaround because job losses were "just" 345,000. That is a higher number than any month in the 2001-02 recession, and larger than the month after 9/11. That is a green shoot? Yes, we will see the monthly unemployment numbers fall, but they are falling from historic highs. And based on some research by the San Francisco Federal Reserve, it is likely that we will see still higher unemployment that will persist for a while longer.
Let me quote and summarize through the research at http://www.frbsf.org/publications/economics/letter/2009/el2009-18.html. (It is not long, and worth reading.)
"Our analysis generally supports projections that labor market weakness will persist, but our findings offer a basis for even greater pessimism about the outlook for the labor market. Specifically, we suggest that the relatively low level of temporary layoffs and high level of involuntary part-time workers make a jobless recovery similar to the one experienced in 1992 a plausible scenario."
Essentially, there are always workers moving into and out of employment. What they note is that the patterns seem to be changing. In the '70s and '80s, job losses were quick and deep, but the recovery was also quick. In the last two recessions, job recovery was noticeably slower, giving rise to the term "jobless recovery." It was the lack of hiring, and not firing, that was responsible for the slow employment recovery. MY thought is that before 1990 many of the job losses in recessions were from manufacturing. Businesses were quick to lay off and quick to rehire. We now have fewer manufacturing jobs, so the rehiring process has been much slower in recent recessions.
"The long and gradual return to pre-recession unemployment levels implied by the Blue Chip consensus forecast is consistent with a labor market recovery that is slightly weaker than that experienced in 1983 and slightly stronger than that experienced in 1992. However, should labor market conditions instead proceed along the path taken in the 1992 recovery, the unemployment rate could peak close to 11% in mid-2010 and remain above 9% through the end of 2011."
That is not in any Congressional budget forecast. Want to run an election campaign at 10% unemployment levels?
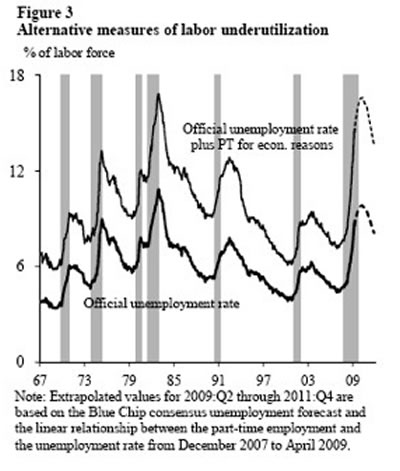
"... What does all this mean for the course of the labor market? We combine data on involuntary part-time workers with the standard unemployment rate to arrive at an alternative measure of labor underutilization. We plot this measure in Figure 3, which shows that the labor market has considerably more slack than the official unemployment rate indicates. The figure extends this labor underutilization measure using the Blue Chip consensus forecast for the unemployment rate as a benchmark and then adding a share of involuntary part-time workers based on the proportion of workers in that category to the unemployed during the current recession. This projection indicates that the level of labor market slack would be higher by the end of 2009 than experienced at any other time in the post-World War II period, implying a longer and slower recovery path for the unemployment rate. This suggests that, more than in previous recessions, when the economy rebounds, employers will tap into their existing workforces rather than hire new workers. This could substantially slow the recovery of the outflow rate and put upward pressure on future unemployment rates." (emphasis mine)
Was Income Really Up?
Now, let's turn our attention to today's headline. Income is surprisingly up. That has to be a green shoot, right? Well, not if you look at the underlying data.
Personal income from wages and salaries was down $12 billion in May. So how did income go up? A large increase in "government social benefits" and a decline in personal taxes accounted for all the gain, and then some. The increase was the effect from the recent stimulus package, which is (for now) temporary, and not the result of a recovering economy. Hardly green shoots. It is just borrowed money from another (government) source. In principle, it is not much different than home equity withdrawal, except that taxpayers are on the hook.
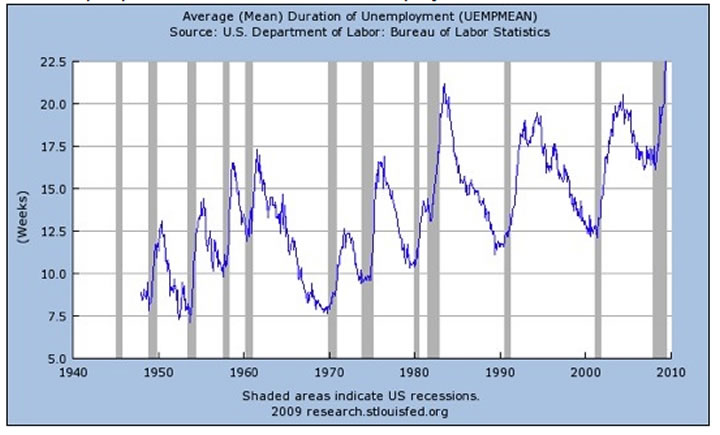
And those government subsidies are going to increase. Look at the graph below. What it shows is that the average duration of unemployment is at a 60-year high, and rising. It is now at 22.5 weeks. Unemployment benefits stop at 39 weeks, temporarily up from 26 weeks. More and more people each week are thrown into very dire circumstances when they fail to find jobs and lose the benefits. Care to wager whether, when Congress comes back from vacation, the time people are allowed to be on unemployment will be increased?
And speaking of the increase in government payments to individuals, what did they do with them? In aggregate, what is happening to this stimulus? The data came out today, and I must admit I was surprised. I have been writing for years that American consumers would start to save in this recession, but I (and nearly every credible observer I read) thought that we would see a more gradual rate of increase in the savings rate. The increase in savings has been nothing short of remarkable. (See graph below.)
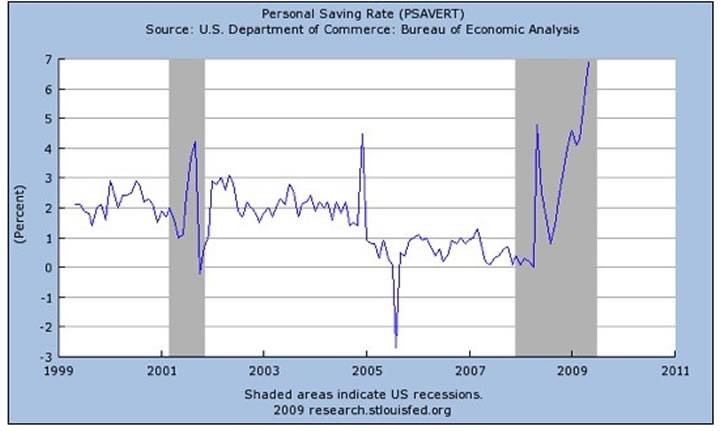
From a negative 3% in late 2005 (the result of massive borrowing, primarily mortgage equity withdrawal and credit cards), we have risen to a positive 6.9%. That is the highest rate since 1993. The savings rate was less than 1% last August. And totals savings (on an annualized basis) was $608 billion in April, rising to $768 billion in May. That is a 30% month-over-month increase! Maybe the American consumer has found a new religion!
But, there is more than just a new savings fervor at work. Spending rose more than disposable income, so without that increased level of government transfer payments, it is unlikely that savings would have risen as much. Before we get too giddy about savings going through the roof, we need to wait a few months to see if this was the result of new savings religion or government transfer payments (stimulus), which will soon wind down
That being said, given the sharp increase in savings, it's no wonder shipping is down 20% and global trade in the exporting economies by 30%. No wonder retail sales are down, except for Wal-Mart and other lower-price venues.
Final thought for today. The Congressional Budget Office released another report this week, saying that the current deficit levels are unsustainable. They suggest that either taxes must increase by $440 billion or spending must be cut by a like amount, or some combination. If you assume some of the new health-care and other programs are enacted, the number comes closer to $700 billion.
This is not a Congress that wants to cut other parts of the budget by $700 billion. Raising taxes by $700 billion (over 4% of GDP) will dip us back into recession. Not raising taxes will result in debt that cannot be funded at anywhere close to today's rates. A recent IMF study is very sobering about the worldwide problem of growing country debt. Finding a trillion dollars in the market every year, when every other country is also trying to raise debt is simply not going to happen. It will destroy the dollar. There are few good choices in front of us, and fewer still good choices that are likely.
OK. One final suggestion for your weekend reading. Atul Gawande, writing in The New Yorker, weaves a very sobering picture of the problem of reining in health-care costs. He contrasts two Texas border cities with similar demographics, yet one spends twice as much on health care. One town has doctors who order every possible test and the other doesn't. There is no real difference in outcomes. And then compare it to other areas, and the problem facing any health-care policy becomes all too evident. Reportedly, Obama has had everyone read this, and you should too. It provides a very different angle on the problem. http://www.newyorker.com/reporting/2009/06/01/090601fa_fact_gawande?yrail
Tulsa, London, and The Baltics
Last Tuesday I went to an Eric Clapton and Steve Winwood concert. At 64, Clapton can still play the guitar as well as anyone on this planet. It is always fun to see a man at the top of his game.
I get up early tomorrow, flying with family to get to Tulsa to be at my daughter Amanda's wedding shower, and then celebrating the twins 24th birthday tomorrow night. Amanda's wedding is August 22, right around the corner. If there is a recession going on, no one in the wedding industry seems to know. This is the second wedding in two years, and I still have two more unmarried daughters. It's a good thing the word retirement is not in my vocabulary. If we can't get the wedding budget under control, I am going to need about 600 new Conversations subscribers in July.
July 15th I leave for London and will guest host CNBC Squawk Box from 7-9 on Friday the 17th. Then on to Finland, St. Petersburg, and the Baltic capitals, and ending in Rome. (Why Rome? Because that is where we could get mileage tickets back to Dallas. But I might as well spend a few days.)
Then I (and my son Trey) will spend one evening and morning in New York August 5-6 before going on to Maine for the regular August fishing extravaganza with David Kotok and a rather fun crowd of economists and other ne'er-do-wells. It is a tough ticket to get, and I am glad to be invited.
There are lots of exciting things happening in my business, and we will be making announcements in the next few weeks. You have a great week.
Your going to listen to more hard blues analyst,
By John Mauldin
John Mauldin, Best-Selling author and recognized financial expert, is also editor of the free Thoughts From the Frontline that goes to over 1 million readers each week. For more information on John or his FREE weekly economic letter go to: http://www.frontlinethoughts.com/learnmore
To subscribe to John Mauldin's E-Letter please click here:http://www.frontlinethoughts.com/subscribe.asp
Copyright 2008 John Mauldin. All Rights Reserved
John Mauldin is president of Millennium Wave Advisors, LLC, a registered investment advisor. All material presented herein is believed to be reliable but we cannot attest to its accuracy. Investment recommendations may change and readers are urged to check with their investment counselors before making any investment decisions. Opinions expressed in these reports may change without prior notice. John Mauldin and/or the staff at Millennium Wave Advisors, LLC may or may not have investments in any funds cited above. Mauldin can be reached at 800-829-7273.
Disclaimer PAST RESULTS ARE NOT INDICATIVE OF FUTURE RESULTS. THERE IS RISK OF LOSS AS WELL AS THE OPPORTUNITY FOR GAIN WHEN INVESTING IN MANAGED FUNDS. WHEN CONSIDERING ALTERNATIVE INVESTMENTS, INCLUDING HEDGE FUNDS, YOU SHOULD CONSIDER VARIOUS RISKS INCLUDING THE FACT THAT SOME PRODUCTS: OFTEN ENGAGE IN LEVERAGING AND OTHER SPECULATIVE INVESTMENT PRACTICES THAT MAY INCREASE THE RISK OF INVESTMENT LOSS, CAN BE ILLIQUID, ARE NOT REQUIRED TO PROVIDE PERIODIC PRICING OR VALUATION INFORMATION TO INVESTORS, MAY INVOLVE COMPLEX TAX STRUCTURES AND DELAYS IN DISTRIBUTING IMPORTANT TAX INFORMATION, ARE NOT SUBJECT TO THE SAME REGULATORY REQUIREMENTS AS MUTUAL FUNDS, OFTEN CHARGE HIGH FEES, AND IN MANY CASES THE UNDERLYING INVESTMENTS ARE NOT TRANSPARENT AND ARE KNOWN ONLY TO THE INVESTMENT MANAGER.
John Mauldin Archive |
© 2005-2022 http://www.MarketOracle.co.uk - The Market Oracle is a FREE Daily Financial Markets Analysis & Forecasting online publication.