


Stock Market Trading Range Continues...Bullish Pattern Holds Potential
Stock-Markets / Stock Index Trading Jun 27, 2009 - 06:33 AM GMTBy: Jack_Steiman

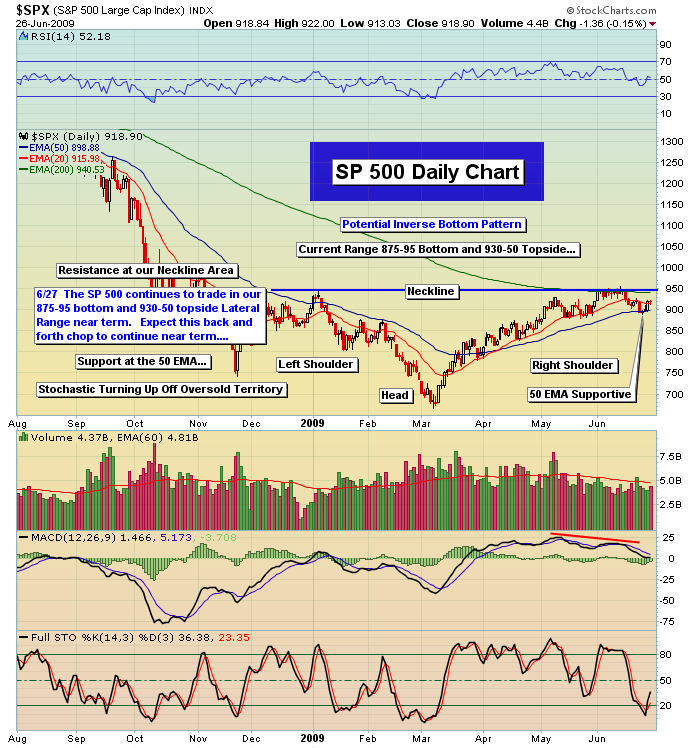
 We had a very interesting week of trading. We saw the bears get their chance to break the market down which would occur if the S&P 500 lost our 875-895 price and 50 EMA Support zone, yet that level was defended by the bulls mid-week. You will be able to see this very clearly in our first chart below of the SP 500. The market spent a long time trying to get through this difficult level when it blasted off the bottom in March. Once it cleared that difficult level the bears tried over and over to take that level back but the bulls would not allow that to take place. Once it became clear that our 50 EMA would hold, we saw a lot of short covering that allowed the market to trend higher late in the week.
Some weeks back the SPX got all the way up to 956, which was above critical resistance at the time at 943 or the 200-day exponential moving average. It seemed as if the market had the all clear signal to race higher. After all, the market leader, the NDX, which historically leads the market both up/down, and Nasdaq had already cleared their 200-day exponential moving average, and with the SPX joining those leading indices there seemed to be no way this market wouldn't go much higher. But something interesting happened on the way to clearing that 943 level that knocked the market back down. Stochastics and RSI, two critical oscillators, got extremely overbought with readings of near 100 and 70 respectively. On top of that, the MACD divergences became negative at very highly compressed levels on all the daily charts, and down the market went. Too many forces working against it.
The market went from looking very bullish to suddenly being in jeopardy of losing that 875 neckline of support. As we headed lower, the oscillators began to unwind very rapidly with the MACD heading back to the zero line that normally stops selling in a healthier environment, while the stochastics went from near 100 across the board on the daily's to below 5. Down to 2 on the Dow. The RSI's unwound from at or near 70 to the upper 30's/mid 40's, and this combination was enough for the buyers to step back in and hold the fort for the bulls and give hope for the future. In addition, by not going all the way to 875 on the S&P 500, it saved it from forming a shorter-term bearish head and shoulders top set up. This alone would keep the wallet on the hip for the bulls as a right shoulder would form only to see it collapse later on. Fortunately for the bulls, this did not take place. It did take place on the Dow, the laggard on the market with its test at 8259, but that's not bearish if not confirmed by the leaders, the Nasdaq, NDX and SPX.
So where are we is the real question being asked these days. The answer is quite simple. We are in a lateral trading range defined by our horizontal price and rising 50 EMA supports that run between 875-900 bottom and the recent highs and 200 EMA that run between the 935-955 area topside. This 80-point range is causing a lot of whipsaw that is causing traders to lose lots of hard earned capital. The swings in price cause a lot of emotional reactions which is normal when the market doesn't seem to have a clear direction. Traders get in but run out fast as soon as the trade goes against them only to feel more frustration when the play comes back. The first chart below shows us in a potential inverse head/shoulder bottom pattern on the S&P 500 with us currently vascillating back in forth in our right shoulder range between 875 bottom and 950ish topside.
The well defined proverbial bull/bear lines in the sand have been drawn. You want to buy weakness on the oscillators as close to the bottom of the range as possible in order to keep losses small should we actually break down. If you like to short, shorting near the top of the range with overbought oscillators makes the most sense. This trading range is clearly defined, but what isn't defined is which way it'll break and how long this trading range will last. There are no set in stone rules for this. You must keep your emotions contained and keep playing on the light side until you get a clean break either way. For now we continue to focus on buying good companies on tests back to rising 50 MA supports and then exiting some exposure nearer the top of our range.
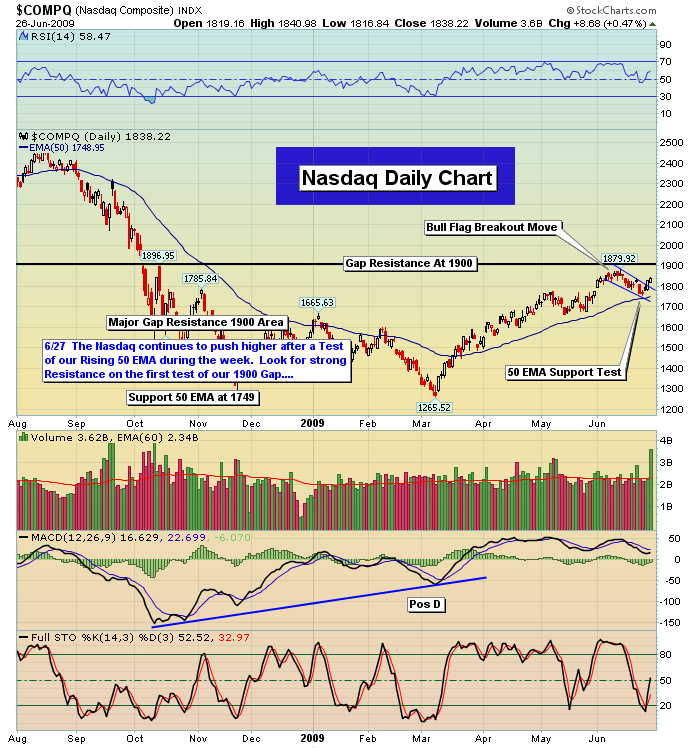
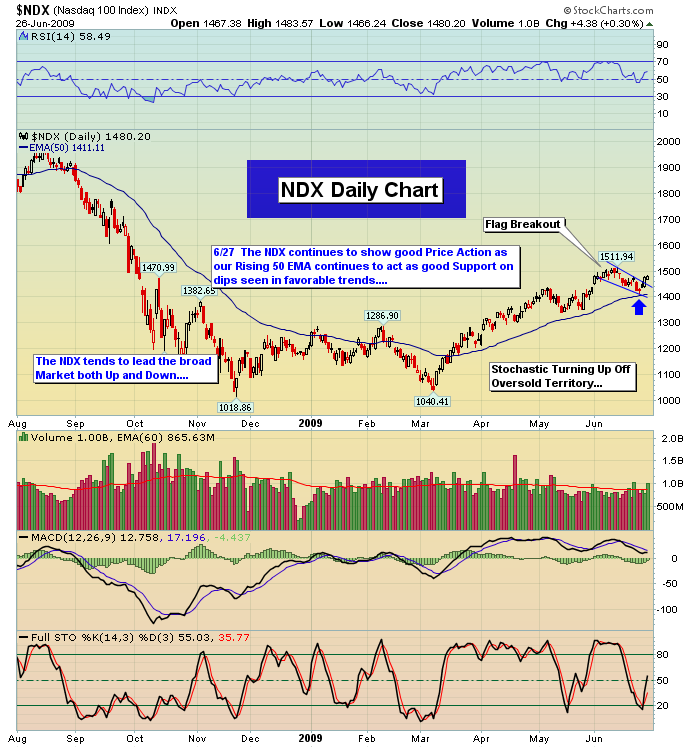
Moving onto our 2nd and 3rd charts below of the Nasdaq/NDX we can see that both continue to remain in favorable uptrends. During the week both tested and held respective 50 EMA's and found buy support there. At some point our trend off the March lows will end but for now it remains in tact. Major support remains in place at our rising 50 EMA's, and on the Nasdaq major resistance comes in at our 1900 Gap area. First tests of gaps tend to provide strong resistance.
Sentiment Analysis
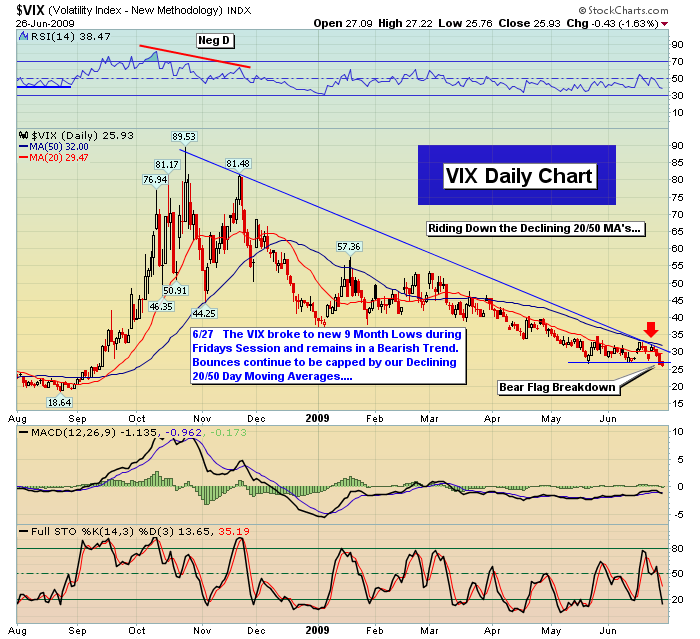
Take a look at our 4th chart below of the VIX. The VIX broke down today to new 9-month lows out of a bearish flag pattern which needs to be respected. Bounces back to our declining 20/50 MA's and continues to get rejected on the VIX which is common in bearish trends (favorable for equities). At some point this trend will reverse, but for now we have to play what we see and recognize that the trend in place remains to the downside for the time being.
Human emotions are based on two realities -- greed and fear -- and I can tell you for sure that fear is a MUCH more powerful emotion than greed. Greed is easy. No emotional work required. Just go along for the ride. Fear is complicated and begets deep emotional responses. When the market is going up all is well but the bullishness is harder to maintain. Many won't believe the market deserves to go up thus we can usually go higher. When the market starts to go down, panic sets in very quickly. Part of this is due to the two huge bear markets we've experienced over the past decade. The 2000-2002 super bear and the incredible seventeen month bear that began in October of 2007 and ended in March 2008. Folks are terribly afraid, any time the market starts to correct, that the next slaughter is around the corner. Bearishness ramps quickly and this is bullish for the markets overall. Some of the widely respected and used sentiment indicators show bearishness ramp fast on pullbacks which is favorable for equities. As long as fear ramps every time we sell, there's a good chance this market will break higher still although most think we've gone too far already.
Sector Watch
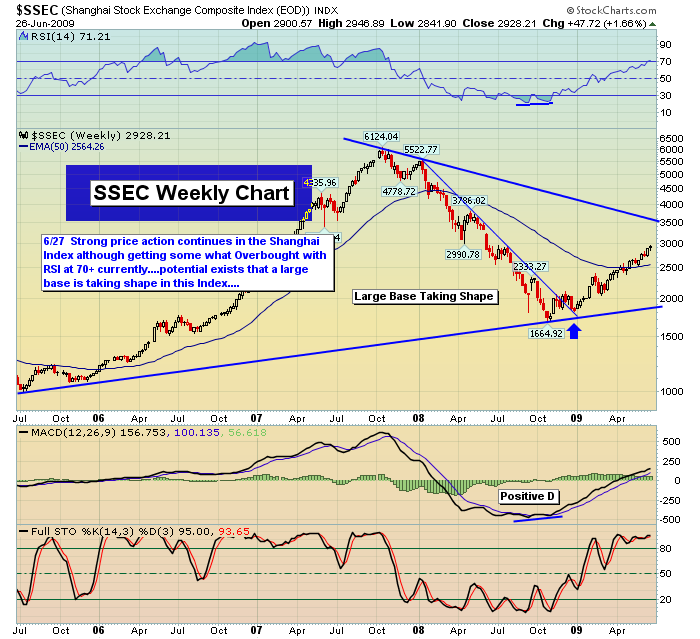
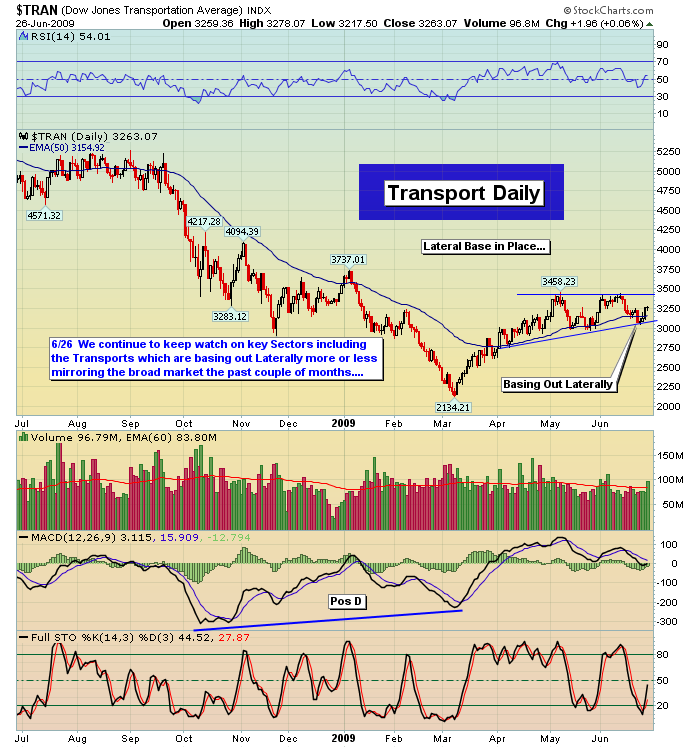
On the sector front the technology area continues to perform well and show leadership qualities on balance. While we've seen a couple of breakdowns in the group, both the Nasdaq and NDX continue to find buy support at our respective 50 MA's on dips. The majority of key stocks in our scans continue to show most leaders mirror this on tests back to key 50 EMA's. Google (GOOG) this week put in a strong late week move after testing back to its rising 50 EMA along with many others. While some groups are running, others remain in consolidation. The transports and financials recovered their 50 EMA's during the week and are in lateral bases. It's important to continue to track their progress in the weeks ahead to make sure they hold up. We have mostly avoided the financial area given the share dilution in many individual stocks. In additon, we continue to find pockets of strength in many of the China plays. Sohu.com (SOHU) and Shanda Interactive (SNDA) continue to perform well on balance. We have included a chart of the Shanghai to show the strong advance off the lows.
The Week Ahead
The week ahead will be very interesting to say the least. With the VIX on a major breakdown, the market has every chance to move higher. We have a gap on the Nasdaq short term at 1838 that may provide some initial resistance and we are getting a bit short term stretched on some of our intraday charts. Most of our daily charts show oscillators turning up out of oversold territory late week. There is an incredible amount of money on the sidelines as well thus it wouldn't take much for this market to take us back up for another test of our critical 935-950 resistance.
With sentiment decidedly bearish as well, there is a real chance for the bullish case to start playing out here. It won't be easy and it'll likely have lots of whipsaw but the door is open. The bears will hope for poor economic reports and poorer earnings that are starting to trickle in to build a strong case against the bulls. Should be a fascinating week but here's the key to it all. Don't over play either way until you see a break take place either way. Until then buying support and fading resistance seems best and don't chase strength would be the safest way to go about your market business.
Peace,
By Jack Steiman
Jack Steiman is author of SwingTradeOnline.com ( www.swingtradeonline.com ). Former columnist for TheStreet.com, Jack is renowned for calling major shifts in the market, including the market bottom in mid-2002 and the market top in October 2007.
Sign up for a Free 30-Day Trial to SwingTradeOnline.com!
© 2009 SwingTradeOnline.com
Mr. Steiman's commentaries and index analysis represent his own opinions and should not be relied upon for purposes of effecting securities transactions or other investing strategies, nor should they be construed as an offer or solicitation of an offer to sell or buy any security. You should not interpret Mr. Steiman's opinions as constituting investment advice. Trades mentioned on the site are hypothetical, not actual, positions.
Jack Steiman Archive |
© 2005-2022 http://www.MarketOracle.co.uk - The Market Oracle is a FREE Daily Financial Markets Analysis & Forecasting online publication.