US Economy Spending & Income: Two Charts
Economics / Recession 2008 - 2010 Jun 26, 2009 - 03:58 PM GMTBy: Adrian_Ash
 "Everyone says higher saving rates are needed. Just not yet – please...?"
"STOCKS SEESAW as savings rate jumps," said the AP on Friday, amending its earlier "Stocks decline" headline to try and fit the moves to the news, rather than the other way round.
Either way, reckon the newswires, "Investors are nervous because consumers are saving more than they're spending."
But if it really was the 15-year high in US personal savings rates – way up at 6.9% of gross income – that spooked investors, just wait until Wall Street gets down to crunching Uncle Sam's give-and-take in the latest Commerce Dept. figures.
And heaven forbid the Chinese take a peek at US consumers' earnings...

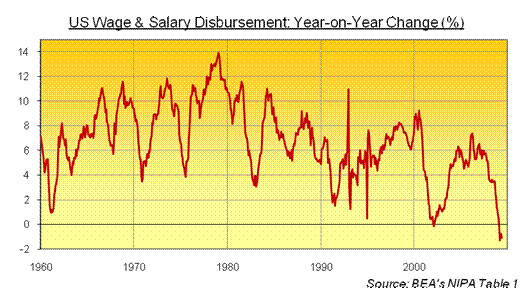
Falling below zero for the first time since 1960 or earlier, nominal US wages have fallen off a cliff in the last six months.
Gross income earned from employment has fallen year-to-date each month in 2009, dropping in May to its lowest level since Oct. 2007 and down more than 2% from the peak of last August.
So how come consumers spending AND saving both rose last month, while pay packets shrank?
"Obviously, for the long run, it has been desired for decades that Americans save more," said one fund manager to Reuters from Illinois. "But in the midst of this recovery [sic] and the stimulus packages that have been put forward, the hope would be to have them spending the money now."
And there's the devil in the detail: the government stimulus.

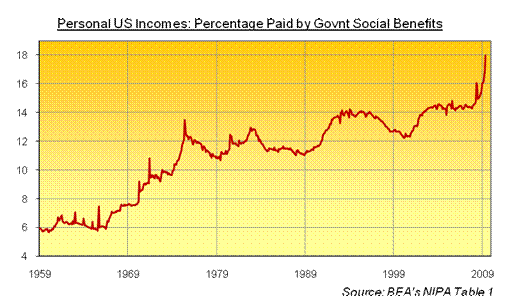
The Bureau of Economic Analysis's Personal Income & Outlays release shows government benefits last month hitting a record both in Dollar terms and as a proportion of gross personal earnings, rising above 17.9% of income across the economy.
For comparison, Uncle Sam's donation to US personal income peaked at 14% during the early 1990s recession. The five-decade average is 11.1%.
Unemployment insurance benefits, meantime, were almost twice the Dollar volume in May of October last year. And yet the Street's apparently worried by US citizens putting too much money aside, rather than by how much Washington's stepped up to support them.
Still think the fiscal or monetary stimulus will make for the exit any time soon...?
By Adrian Ash
BullionVault.com
Gold price chart, no delay | Free Report: 5 Myths of the Gold Market
City correspondent for The Daily Reckoning in London and a regular contributor to MoneyWeek magazine, Adrian Ash is the editor of Gold News and head of research at www.BullionVault.com , giving you direct access to investment gold, vaulted in Zurich , on $3 spreads and 0.8% dealing fees.
(c) BullionVault 2009
Please Note: This article is to inform your thinking, not lead it. Only you can decide the best place for your money, and any decision you make will put your money at risk. Information or data included here may have already been overtaken by events – and must be verified elsewhere – should you choose to act on it.
Adrian Ash Archive |
© 2005-2022 http://www.MarketOracle.co.uk - The Market Oracle is a FREE Daily Financial Markets Analysis & Forecasting online publication.


