


Stocks Bear Market and Financial Crisis Not Over, US Regional Banks The Next to Go
Stock-Markets / Stocks Bear Market Jun 25, 2009 - 12:49 PM GMTBy: Garry_Abeshouse

 It is consistent in major bear markets that follow through to the end, for the stocks in sectors showing the most weakness to fall between 80% and 90% from their highs.
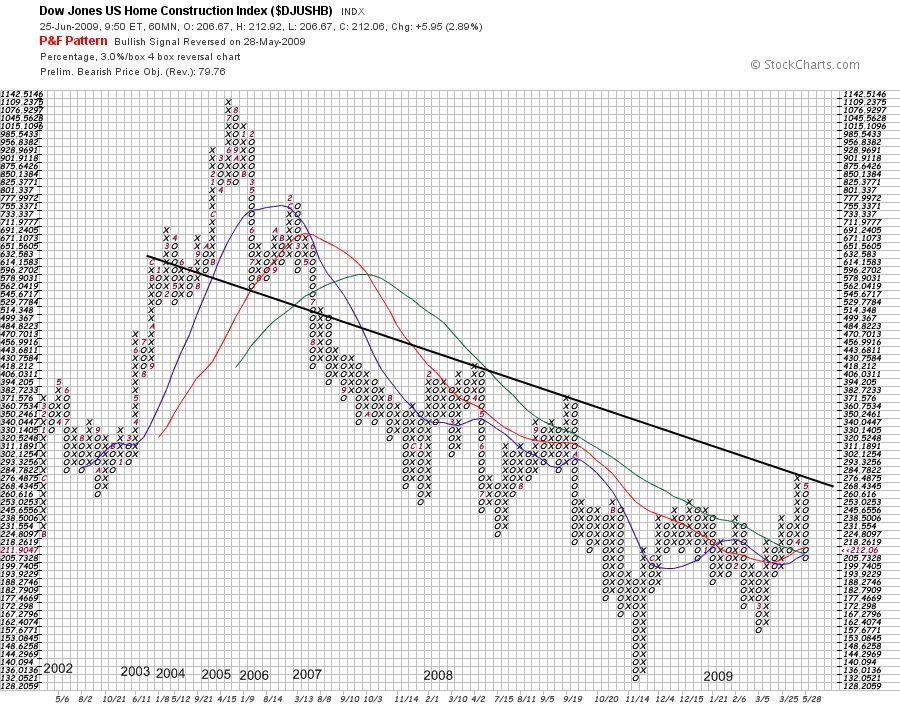
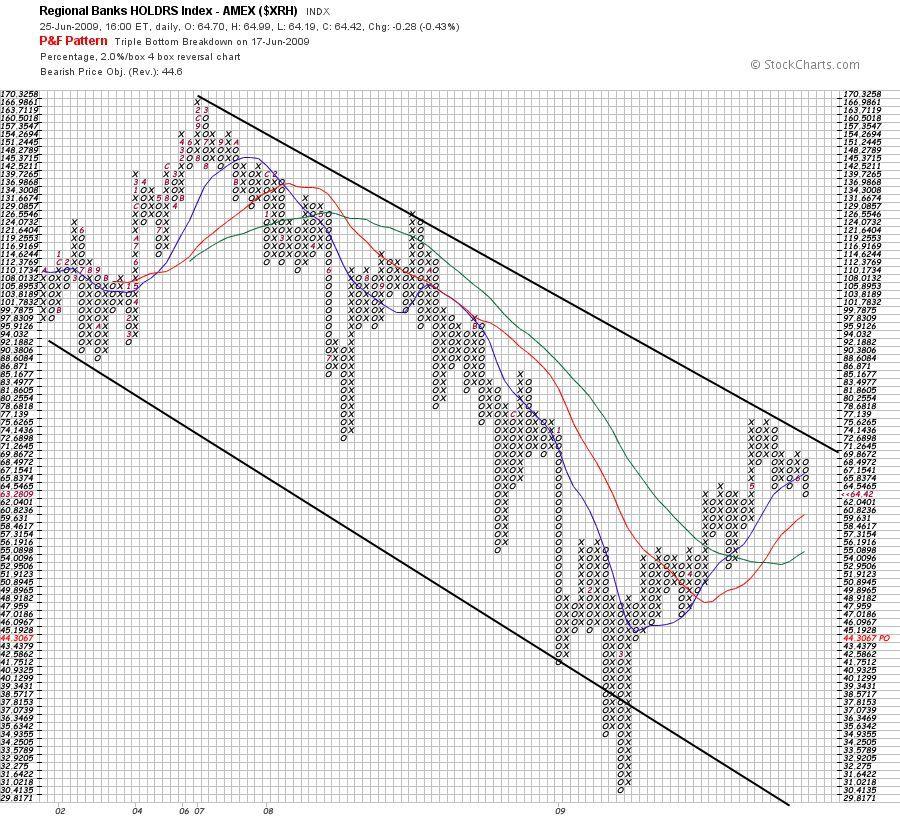
In the USA Regional Banks (the smallest and the weakest links in in banking sector) together with anything to do with Housing and Real Estate, general Insurance and RE Insurance companies - would be some of the weakest links in the USA's financial morass.
Below taken from: http://www.marketoracle.co.uk/Article11551.html :
"The 20 biggest banks in the country control $3.5 trillion of the $7.1 trillion deposits in the country. There are 8,400 banks in the country and 20 banks control 50% of the deposits. The list below reads like a who’s who list of the worst run banks in history that took the greatest risks and lost the most money.
The total credit card debt outstanding in the U.S. at the end of 2008 was $960 billion. The top 15 credit card issuers hold $793 billion of this credit card debt, or 83% of all the debt. They also hold a major portion of auto loans, home equity loans and personal loans."
"There are currently $15 trillion of mortgage loans outstanding in the U.S. You may be surprised to learn that the biggest banks in the U.S. hold the majority of the mortgages in the country. These banks issued the subprime and Alt-A toxic mortgages that brought the financial system to the brink of collapse. There is no doubt after examining these figures that the mega-banks control the country’s financial system. Ben Bernanke, Hank Paulson, and Tim Geithner have decided that these banks need to be saved at the expense of senior citizens and the American taxpayer."
This means that the smallest 8380 of the US banks control 50% of the deposits in the USA, which means that each of these banks have on average only 0.006% of US deposits each. Each a flea on the backside of a giant.
How many of these banks will the USA allow to close their doors before panic sets in? And what about the 8,000 credit unions in the USA?
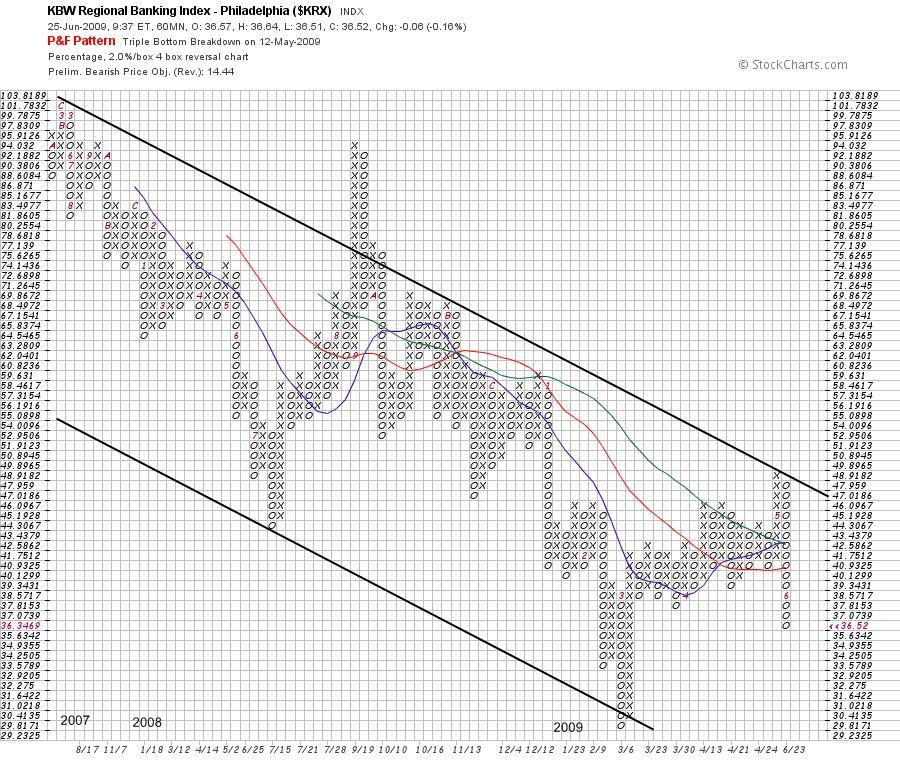
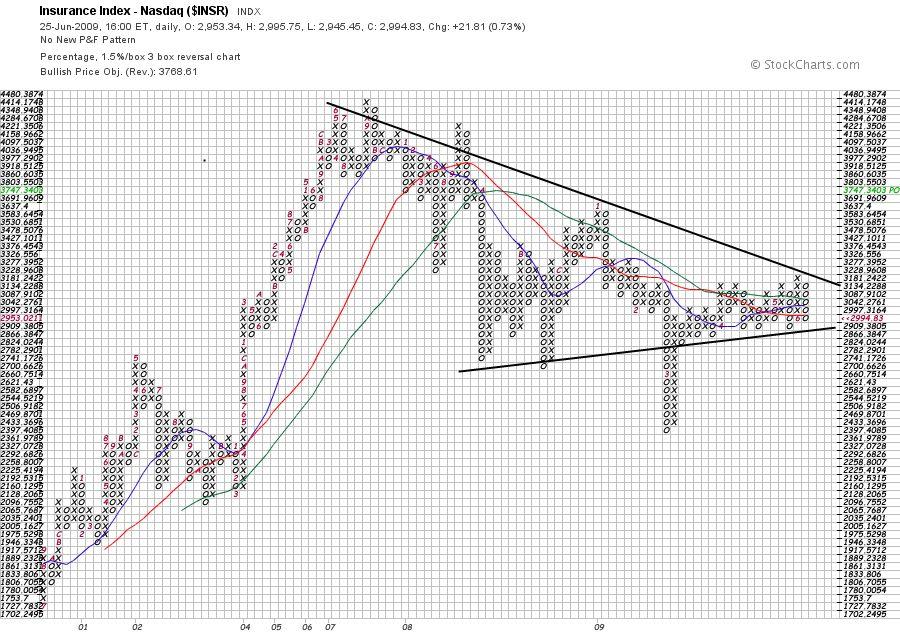
The following eight charts are longer term studies from the banking, insurance and housing sectors. Earlier charts sent out were shorter term studies.
After the recent rally of approx. between 30% and 40% in the indexes, all the charts below paint a similar picture of intact downtrends going back many years.
The fact that after the recent strong rise, these downtrends are ALL still intact, significantly strengthens the case for a continuation of the bear market, following any significant move down from current levels.
The bearish patterns on the shorter term charts, if fully confirmed by a downside break, will certainly weaken, if not destroy, the bullish case so predominant in financial circles at the moment.
There is certainly no case yet that the market has seen the lows, this will have to be proven by future market action.
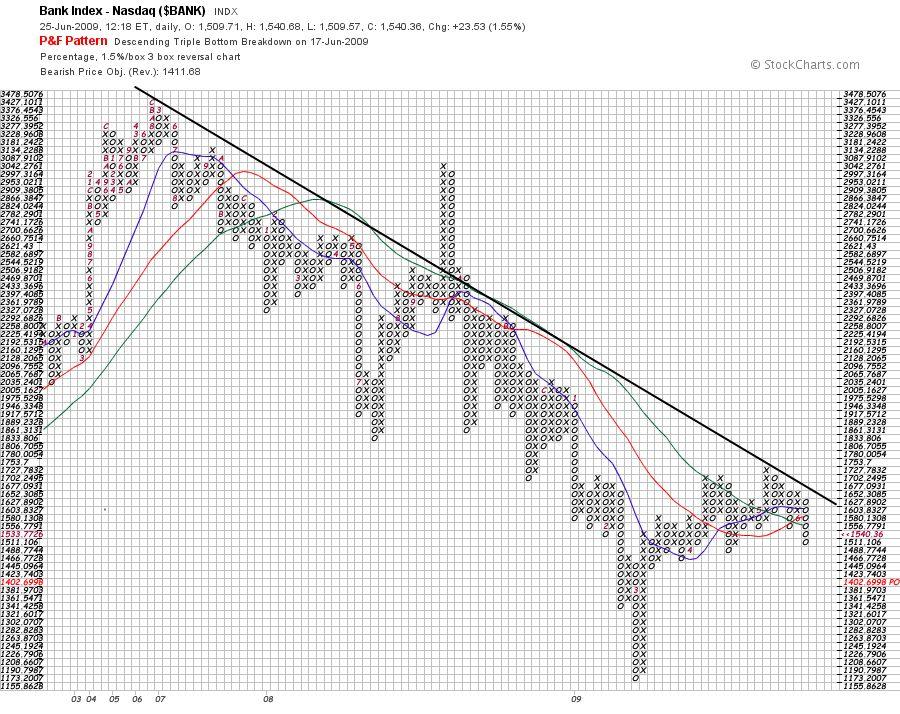
The most important chart of the bunch though, would have to be the Nasdaq Banking Index, representing the top end of the baking sector. This chart paints a most disturbing picture of the bear market so far, together with its portents of more bad news to come.
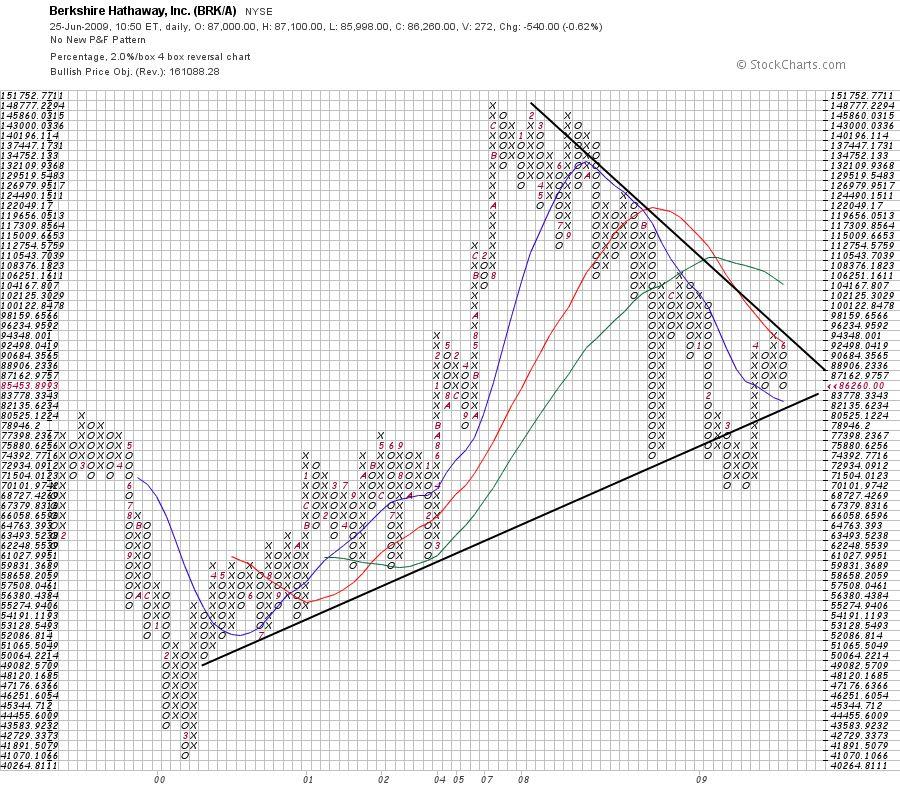
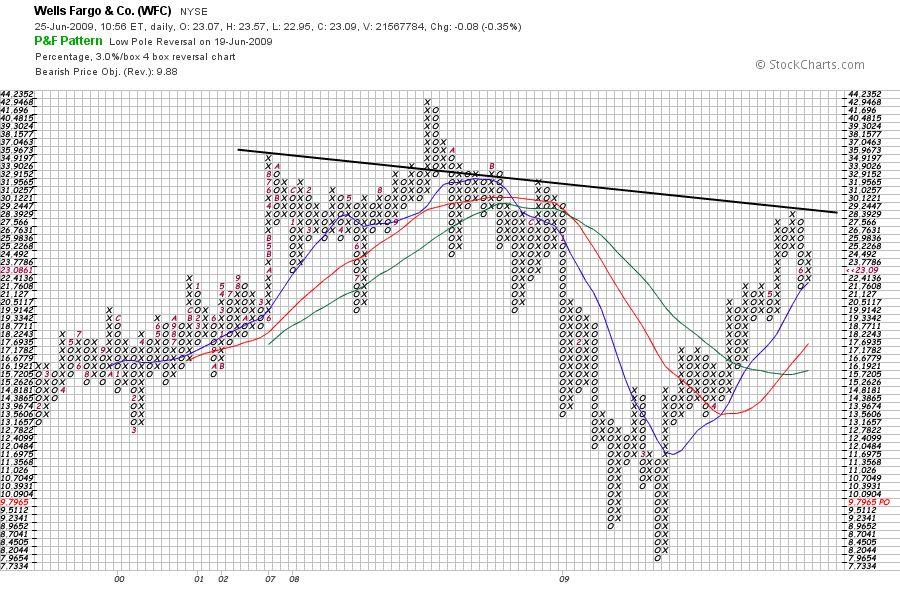
Note that Berkshire Hathaway is the largest reinsurer in the USA and has just increased its holding in Wells Fargo, also shown.
You can see the price of Wells Fargo has risen from $8 to $28, and looks uncomfortably high on the chart.
Wells Fargo was the top originator of mortgage loans for 2008 (not a good year for US mortgages at valuations well above current prices), and is the 4th largest deposit holder and the 7th largest issuer of Credit cards in the USA.
I would say the pull back here in US equities, and thus ours as well, will not be a strong one - just strong enough to prolong the agony before the next leg down.
I would expect the next leg down to occur some time between now and mid January, 2010, with the highest probability that it will happen before the end of October, 2009.
That would make it exactly 80 years almost to the day, after the 1929 crash.
Garry Abeshouse
Technical Analyst.
Sydney
Australia
I have been practicing Technical Analysis since 1969, learning the hard way during the Australian Mining Boom. I was Head Chartist with Bain & Co, (now Deutsch Bank)in the mid 1970's and am now working freelance. I am currently writing a series of articles for the international "Your Trading Edge" magazine entitled "Market Cycles and Technical Analysis".
I have always specialised in medium to long term market strategies and after discovering the excellent Point & Figure Charts from Stockcharts.com in mid 2008, have concentrated on this style of charting ever since.

Disclaimer: The above is a matter of opinion provided for general information purposes only and is not intended as investment advice. Information and analysis above are derived from sources and utilising methods believed to be reliable, but we cannot accept responsibility for any losses you may incur as a result of this analysis. Individuals should consult with their personal financial advisors.
© 2005-2022 http://www.MarketOracle.co.uk - The Market Oracle is a FREE Daily Financial Markets Analysis & Forecasting online publication.