


Gold, Crude Oil and Gas Commodity Trading Made Simple
Commodities / Commodities Trading Jun 24, 2009 - 05:09 PM GMTBy: Chris_Vermeulen

 In the past commodity trading was only available to trader with large accounts, high risk tolerance and a good understanding of how the futures market works. During the past 7 years with commodities making incredible moves and gaining attention from the media, several exchange traded funds (ETF’s) have been created allowing everyone to take advantage of the commodity market.
Gold was the first commodity back in 2002 which really made traders and investors want into the commodity market. Silver was followed shortly after in popularity, then crude oil and natural gas. While most commodities were on fire these are the ones that the media took a hold of and make them well known to everyone as prices soared month after month.
Commodities should have a place in everyone’s portfolio in my opinion. And a simple way of doing that is through the use of etf’s. Below I provide some of the most popular commodity funds known today. I have provided my simple analysis to each fund so you can see how commodity trading is like if you know what you are doing or have someone help you along the way.
I have provided two charts of each fund so that you can see the difference between trading a weekly chart and a daily chart. In short the weekly chart moves at 1/5th the speed of the daily. This is a great time frame for most investors if they want to actively manage their accounts catching market trends. The daily chart requires more analysis and trading because the chart provides several opportunities on a monthly basis. This is geared toward a much more active type of trader/investor.
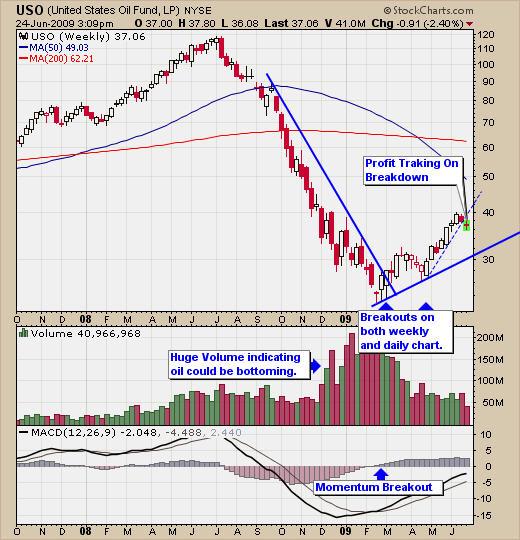
USO Fund – Crude Oil Fund – Weekly Chart
As you can see from the weekly chart below this fund trends very nicely. I focus on price action, support & resistance levels, volume, trend lines and chart patterns to trade these funds.
Back in March there was a breakout to the upside, then a reversal bounce in April providing another excellent point to enter the oil market. Using my analysis I can locate low risk entry points for oil. This chart provided a trade which lasted several months. The exit point was signaled after there was a trend line break this week.
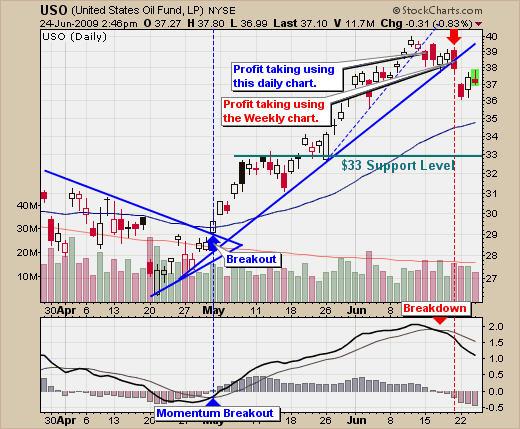
USO Fund – Crude Oil Fund – Daily Chart
The daily chart below shows a close up of the price action and how to take advantage of these funds. Trading the daily chart allow you to really fine tune trades so that you can squeeze out as much profit as possible. Profit taking is generally done on a daily chart trend line break and the core position will be exited on a longer term trend line break such as the weekly chart. This is shown on the chart below.
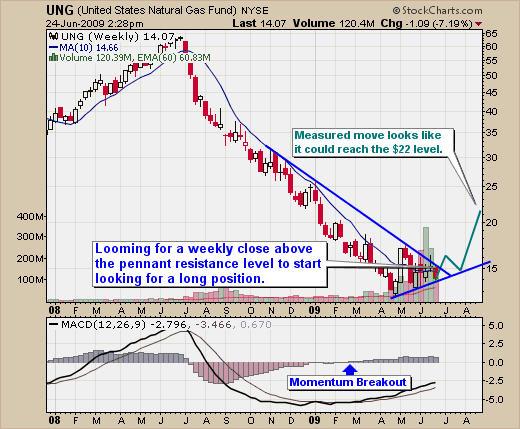
UNG Fund – Natural Gas Fund – Weekly Chart
Here are two charts of natural gas. This chart shows the longer time frame and overall interest in the commodity. Volume has picked up as traders anticipate a reversal to the upside.
UNG Fund – Natural Gas Fund – Weekly Chart
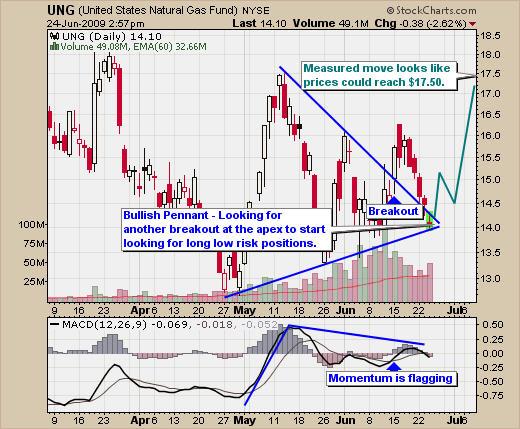
This daily chart is a little tough on the eyes because of the recent volatility. But you can see the price broke out of is pennant pattern 8 days ago and is now testing support again. I expect this fund to move higher but there are several rules and price patterns which must confirm before any money would be put to work. Just because it looks like it’s going higher does not mean its going right now.
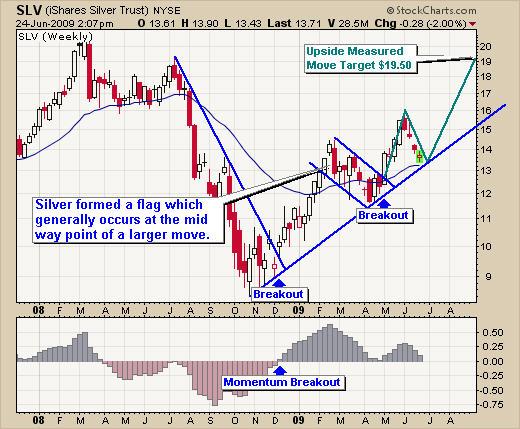
SLV Fund – Silver Fund – Weekly Chart
Silver made a nice breakout back in December. We can see that it had a controlled pullback for a couple months earlier this year. The recent rally is now pulling back and testing the support trend line. This has been a 6 month trade if you were trading the weekly chart.
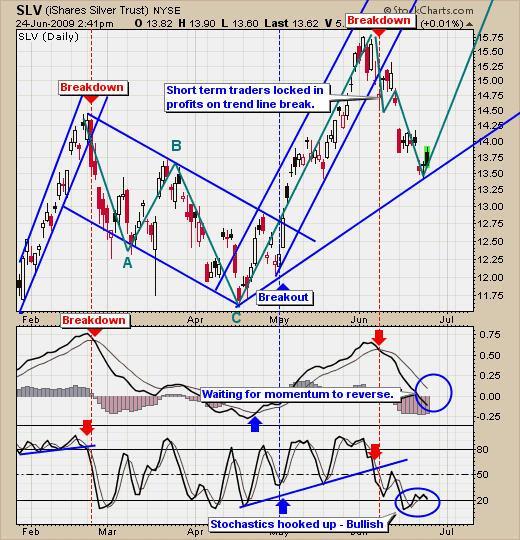
SLV Fund – Silver Fund – Daily Chart
This is another good example of trading the daily chart because it shows all the noise and opportunities for the short term trader.
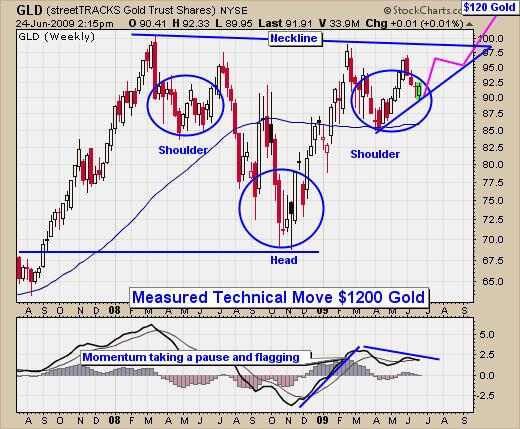
GLD Fund – Gold Fund – Weekly Chart
The gld gold fund is my favorite to trade out of them all. While is moves the slowest I find it the most accurate. Gold looks to be setting up for a nice breakout later this year if prices hold up and the US dollar continues to collapse.
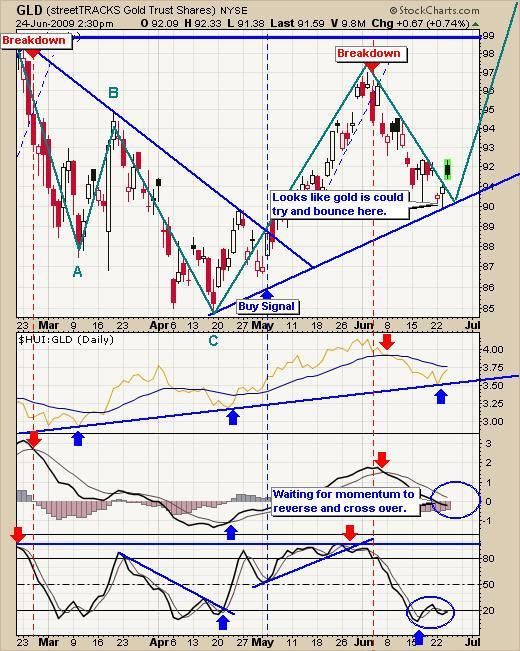
GLD Fund – Gold Fund – Daily Chart
Short term traders like myself enjoy trading this fund. While gold looks like a buy at this level I do not risk any money until I have a low risk entry point which is calculated buy price action, momentum and volume. Waiting for the setup can be a painful process but not as painful as losing a lot of money on a trade which had a higher risk level.
Commodity Fund Trading Conclusion:
Trading with etf’s and other funds really do make investing much easier for individual traders. Not only can we trade commodities but we can rotate from sector to sector or trade indexes if we feel the broad market is going to rally or sell off. There are always trading opportunities available some where.
Trading funds is very much the same as stocks. Funds generally move slower and are not as vulnerable to individual stocks news. The key is finding a strategy that works with you’re personality type and staying disciplined enough to follow your trading plan.
Hello, I'm Chris Vermeulen founder of TheGoldAndOilGuy and NOW is YOUR Opportunity to start trading GOLD, SILVER & OIL for BIG PROFITS. Let me help you get started.
If you would like more information on my trading model or to receive my Free Weekly Trading Reports - Click Here
I have put together a Recession Special package for yearly subscribers which is if you join for a year ($299) I will send you $300 FREE in gas, merchandise or grocery vouchers FREE which work with all gas stations, all grocery stores and over 100 different retail outlets in USA & Canada.
If you have any questions please feel free to send me an email. My passion is to help others and for us all to make money together with little down side risk.
To Your Financial Success,
By Chris Vermeulen
Chris@TheGoldAndOilGuy.com
Please visit my website for more information. http://www.TheGoldAndOilGuy.com
Chris Vermeulen is Founder of the popular trading site TheGoldAndOilGuy.com. There he shares his highly successful, low-risk trading method. For 6 years Chris has been a leader in teaching others to skillfully trade in gold, oil, and silver in both bull and bear markets. Subscribers to his service depend on Chris' uniquely consistent investment opportunities that carry exceptionally low risk and high return.
This article is intended solely for information purposes. The opinions are those of the author only. Please conduct further research and consult your financial advisor before making any investment/trading decision. No responsibility can be accepted for losses that may result as a consequence of trading on the basis of this analysis.
Chris Vermeulen Archive |
© 2005-2022 http://www.MarketOracle.co.uk - The Market Oracle is a FREE Daily Financial Markets Analysis & Forecasting online publication.