Gold and U.S. Dollar Trends Update
Commodities / Gold & Silver 2009 Jun 24, 2009 - 01:06 PM GMTBy: Jordan_Roy_Byrne
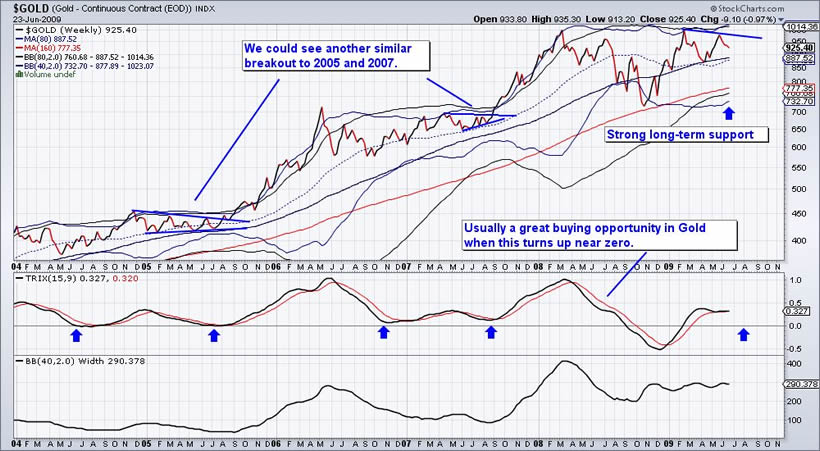
 Gold - Below is a weekly line chart of Gold. Each data point is the closing price on Friday. There are two main supports. The first is at about $880 where the 40-week and 80-week moving averages reside. Should that area break then look for a bottom close to $800. There is a lot of support filling in towards $800. My thinking is that the market will trade in similar fashion (triangle) to what we saw in 2005 and 2007. The bottom chart on the picture is the width of the 40-week bollinger bands.
The lower 80-week band (black) is actually inside of the lower 40-week band. This means that long-term volatility is actually more compressed then intermediate or medium term volatility. A few more months of consolidation would help close the 40-week bands. The lower band is already starting to move up.

Gold Commitment of Traders Data
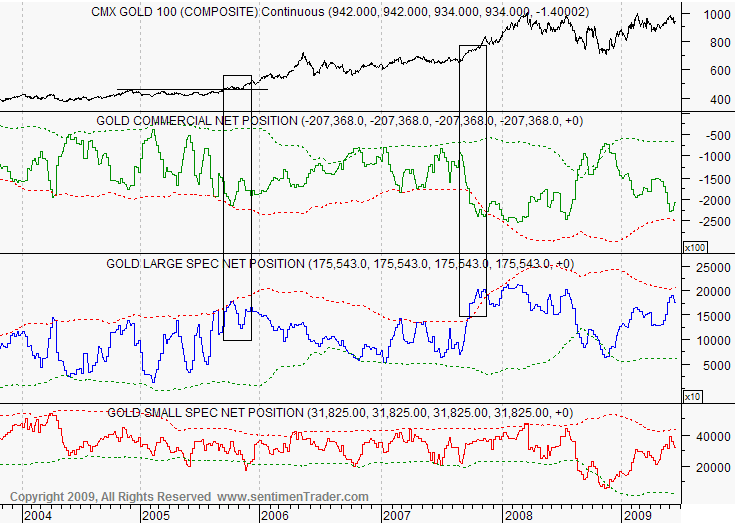
Below is a chart from sentimentrader.com with my annotations. The COT data is a helpful tool for spotting low and high-risk points. The point I’m making now is that the large speculators tend to be right about the major breakouts. Look at the positions of the commercial traders (2nd row) and large speculators (blue) during the breakouts in 2005 and 2007. Point being, you shouldn’t wait around for this indicator to give you a buy signal before a major breakout. Certainly bulls want to see this and other sentiment indicators indicate pessimism. The reality though is that sentiment actually follows trend most of the time. We’d like to see commercial short positions decline some more, but they won’t need to be at a major bottom for this breakout in Gold to occur.

US Dollar
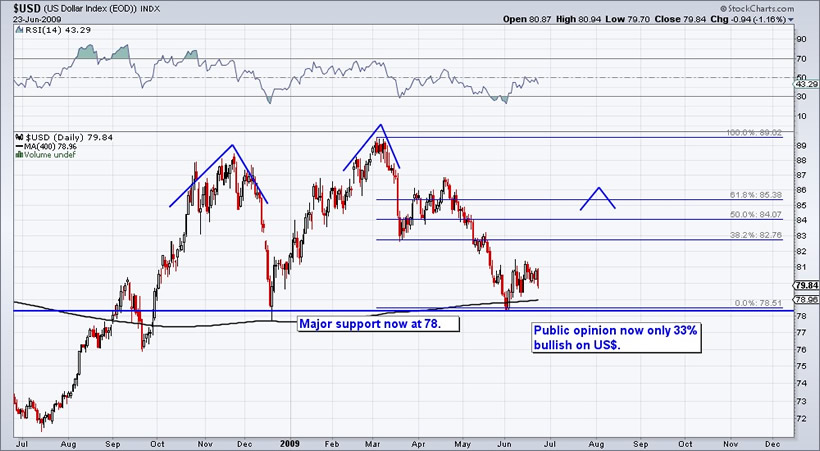
I would be very surprised if the greenback broke through that major support in the next few days or weeks. Public opinion is only 33% bullish. I see the buck building a right shoulder (rally to 84-85). Another possibility is that the market grinds between 78 and 82 for a while, thereby working off the oversold condition and overly bearish sentiment. Given the sentiment and technical support, a huge breakdown here is very unlikely. If the dollar does build a right shoulder over the summer then that bodes ill for its prospect come fall and winter. Longer-term we know that the ECB is likely to be more hawkish and the Fed more dovish (surprise!). In the near term, keep an eye on how Gold performs against the other currencies. A breakout in Gold would be preceded by gold strength against foreign currencies. We have not seen that since the first quarter.

Gold Stocks
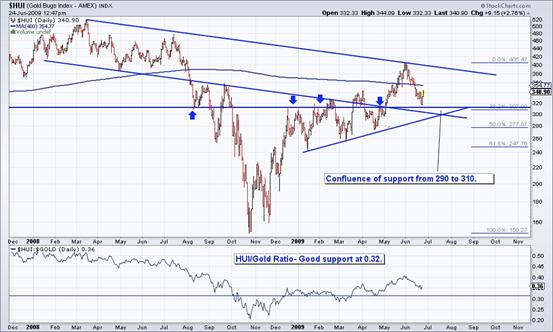
The HUI could rally as high as 355-360 where there is formidable short-term resistance. We’d look to accumulate in the 290 to 310 zone where there is a good confluence of support. If we had to guess, we’d say 280 is the bottom. The HUI/Gold ratio seems to have good support near 0.32. Gold at $880 with HUI/Gold at 0.32 equates to 282 on the HUI.

If you are interested in more detailed and thorough analysis of Gold, Silver, the Dollar, and numerous gold/silver stocks, then you can click the link below to find out all the details about our new newsletter. We specialize in tracking the technicals and sentiment (short term options data and short interest) on 40 gold/silver stocks.
http://trendsman.com/Newsletter/GSletter.htm
By Jordan Roy-Byrne
trendsman@trendsman.com
Editor of Trendsman Newsletter
http://trendsman.com
Trendsman” is an affiliate member of the Market Technicians Association (MTA) and is enrolled in their CMT Program, which certifies professionals in the field of technical analysis. He will be taking the final exam in Spring 07. Trendsman focuses on technical analysis but analyzes fundamentals and investor psychology in tandem with the charts. He credits his success to an immense love of the markets and an insatiable thirst for knowledge and profits.
Jordan Roy-Byrne Archive |
© 2005-2022 http://www.MarketOracle.co.uk - The Market Oracle is a FREE Daily Financial Markets Analysis & Forecasting online publication.


