


Stock Market Investing Long-term Buy and Hold Still Bad Advice
InvestorEducation / Learning to Invest Jun 24, 2009 - 12:43 PM GMTBy: Mike_Shedlock

 In spite of what you hear from main stream media and self-serving advice from Wall Street, an investment philosophy of long term buy and hold is not what it's cracked up to be.
Unfortunately, many boomers headed into retirement are finding that out now, at the worst possible time. Moreover, looking ahead, I doubt the next decade is not going to be much better than the last.
Please consider the following analysis from my friend "TC"
Recently a CalPERS spokesman was on CNBC talking about how they’re “managing” through the market downturn and how over the long haul they feel confident they’ll hit their 8% annual target. Also consider The house that Jack built, a MarketWatch article in which Jack Bogle reiterated his “buy and hold” investment recommendation.
Meanwhile in the same period my parents reiterated their successful and simple retirement strategy – CD laddering. This caused me to set out and look into greater detail about the market’s historical return, analyze buy and hold and see if an 8% annual market return target is even achievable.
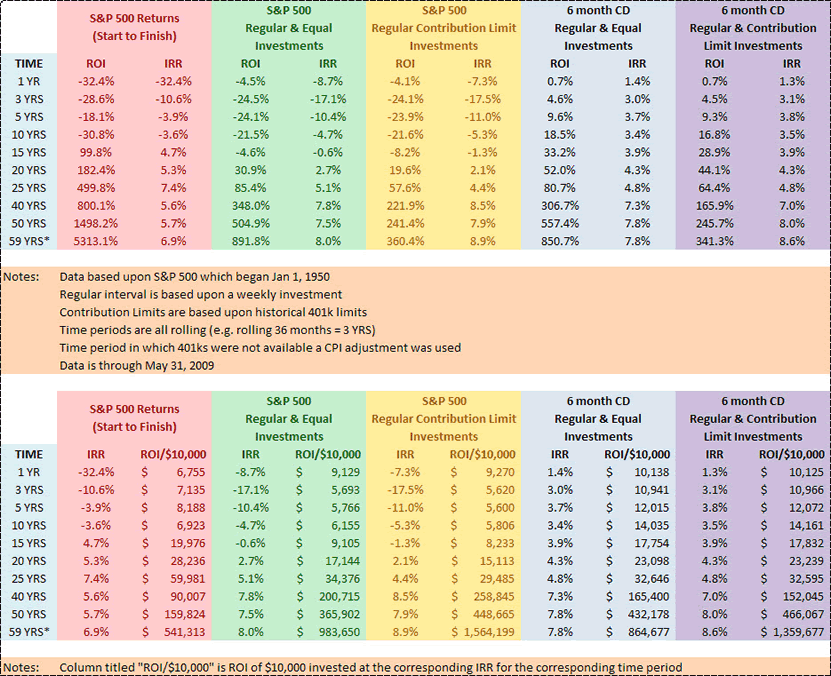
My findings about the market from start to finish were of no surprise. The S&P 500 is down 32% over the past 12 months and down 31% over the past 10 years (-3.6%/yr). However, it’s the “long haul” where I’ve been promised and 8% annual return – and sure enough the returns did improve. The S&P 500 is up 100% (+4.7%/yr) over the past 15 years, up 500% (+7.4%/yr) over the past 25 years and up a staggering 5,313% (+6.9%/yr) since inception in 1950.
Although the annual ROI amounts fell short of the 8% target, it seemed reasonable that CalPERS in its infinite “wisdom” could outperform near 60 year market return by 1.1 annual percentage points.
However, the problem with looking at these returns is that they bare no semblance to reality. CalPERS or an individual doesn’t investment all their money on January 1, 1950 and then buy and hold. Rather individuals make regular contributions through their working years and dollar cost average into the market.
And according to CNBC’s clueless happy talker Dennis Kneale this is how individual investors can assure themselves they won’t lose and will make a killing in the market.
Due to different holding periods, the next references will all be related to Internal Rate of Return (IRR).
True to Dennis’ hope over the past 12 months a strategy of dollar cost averaging into the market improves an individuals’ IRR to -8.7% (compared with -32.4%). However, for the next 6 time periods, dollar cost averaging into the market actually hampered performance. Additionally, one has to extend the time period to at least 20 years in order to even show a positive IRR!
For example the 3 year time period resulted in -17.1%/yr (compared with -10.6%/yr) and a 15 year period resulted in -0.6%/yr (compared with +4.7%/yr). Fortunately, when you extend out the window to 38 years or more, dollar cost averaging once again works in your favor. But how many investors have been systematically investing this long?
Keeping my parents in mind, you’re probably wondering how someone did by simply investing in 6 month CDs. The answer is for any holding period of less than 25 years, a stock market investor who made regular and equal contributions has actually underperformed a CD investor! Yes, you read that right for time periods of 1 – 20 years a CD investor outperformed the stock market by 1.6 to 20.1 annual percentage points.
Additionally, if one extends the time window to 50 years (clearly “long term”) CDs again have outperformed the stock market by 0.3 annual percentage points. Even when one extends out the time period to the full 59+ years (the start of the S&P 500 index); the stock market has outperformed short-term CDs by a mere 0.2 annual percentage points – not much of an equity premium.
However, the problem with dollar cost averaging into the market is that over the long term is that uniform dollar cost averaging bares little semblance to reality. Individuals typically invest more each year as the value of their dollars fall due to inflation. In other words if they invested $10,000 annual today – they surely didn’t also invest $10,000 in 1980, rather they invested $4,000 (an inflation equivalent). To account for this, contribution limits on retirement accounts increase annually.
I reran the numbers using the annual 401k contribution limits for the weekly investment and the results surprised me.
Imagine you’re 55 years old, investing for the past 25 years and looking to retire. Assuming you invested $250,000 (roughly the 401k maximum over the time period) you now have about $725,000 – not too bad right? Meanwhile “my parents” experienced none of the volatility and have just over $800,000. Which would you choose?
Now imagine you’re in your early 40s and investing for the past 15 years. Assuming you invested $175,000 (roughly the 401k maximum over the time period) you now have less than $150,000 – a loss of nearly 18% over a 15 year horizon. Meanwhile, “my parents” experienced none of the volatility and have over $300,000 – nearly an 80% gain. It is going to be near impossible for today's early 40s investor to overcome this 116% divergence. Even if the stock market doubles tomorrow “my parents” are still ahead of the average market investor.
Buy And Hold Vs. CD Laddering
To help show this disparity of an IRR of -1.3%/year vs. +3.9%/year over 15 years I included a chart of return per $10,000 invested. Looking at the above chart one should quickly realize they either need to be active investors or stick to simple, unsophisticated CD investing.
TC is ignoring dividends, and stock selection. Then again stock selection would imply some activity as sectors fall in and out of favor.
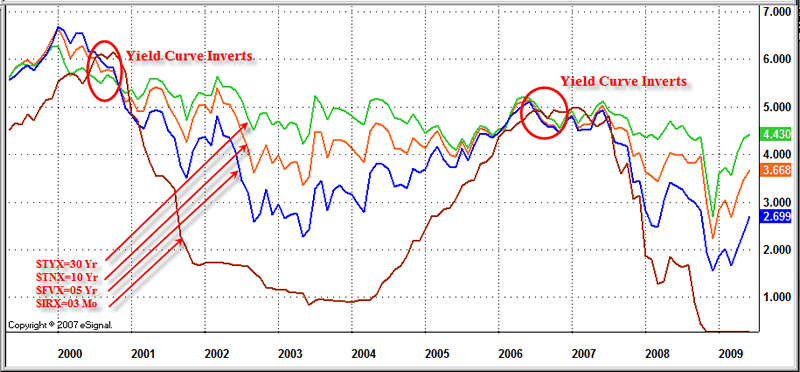
One simple, active strategy that would have avoided the stock market holocaust in both the recent recessions would be to get out of the market when the yield curve inverts and stay out until the NBER announces the recession has ended.
Treasury Yield Curve 1999 To Present
Length of US Recessions 1900-Present
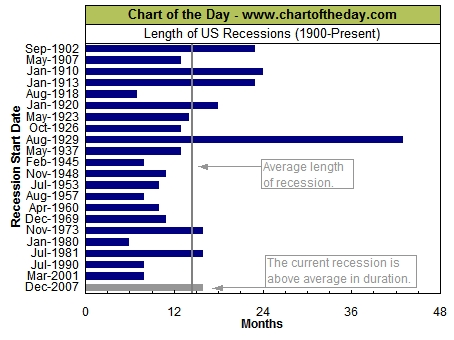
The above chart from Chart of the Day as posted in Trader's Narrative.
Using the above two charts one would have exited the stock Market in Spring of 2000 and reentered in November of 2001. One would have exited the stock market in Summer of 2006 and would still be out.
One could have improved returns by buying long dated treasuries after exiting the stock market. Of course one can improve upon the CD strategy by buying 6 months treasuries, switching to 10 year treasuries when the yield curve inverted and back after into 6 month treasuries when the yield curve gets sufficiently steep.
Regardless of what strategy one uses, it is a horrible idea to hold stocks thought recessions.
Why Is Bad Advice So Common?
Clearly, stay the course is bad advice. So why is it so common? A personal anecdote might help explain things: In January of this year, an investment advisor from Wachovia Securities called me up and stated "Mish, I am sitting on millions because I see nothing I like". I told the person I did not like much either and that Sitka Pacific was heavily in cash and or hedged. His response was "Well, I do not get paid anything if my clients are sitting in cash".
I called up a rep at Merrill Lynch and he said the same thing, that reps for Merrill Lynch do not get paid if their clients are sitting in cash.
Massive Conflict of Interest
Notice the massive conflict of interest possibilities. Reps for various broker dealers have a vested interest in keeping clients 100% invested 100% of the time, even if they know it is wrong. And so it is every recession, bad advice permeates the airwaves and internet "Stay The Course".
A Look Ahead
Clearly stocks are a better buy now than in 2007 or 2008. But that does not mean stocks are cheap. Indeed, by any realistic measure of earnings, stocks are decidedly not cheap. Then again, 6-month treasury yields are yielding a paltry .31%.
Can equities easily beat that? Yes they might, but that does not mean they will! Fundamentally, the S&P 500 can easily fall to 500 or below, a massive crash from this point. Alternatively, stocks might languish for years.
Please consider a chart of the Nikkei.
$NIKK - Nikkei Monthly Chart
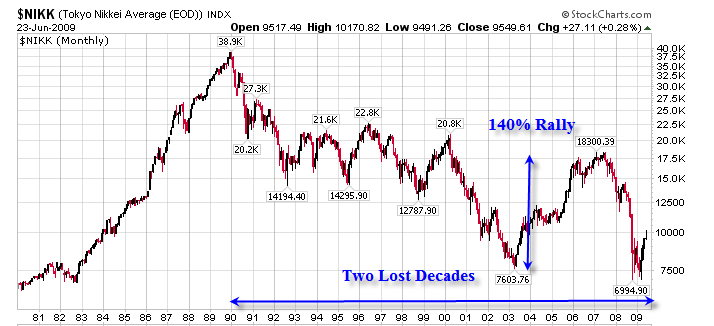
The Japanese Stock Market is about 25% of what it was close to 20 years ago! Yes, I know, the US is not Japan, that deflation can't happen here, etc, etc. Of course deflation did happen here, so the question now is how long it lasts. Even if it does not last long, there are no guarantees the stock market stages a significant recovery.
Buy and hold is no more likely to be a good choice for the next 5 years than it was for the last 20.
By Mike "Mish" Shedlock
http://globaleconomicanalysis.blogspot.com
Click Here To Scroll Thru My Recent Post List
Mike Shedlock / Mish is a registered investment advisor representative for SitkaPacific Capital Management . Sitka Pacific is an asset management firm whose goal is strong performance and low volatility, regardless of market direction.
Visit Sitka Pacific's Account Management Page to learn more about wealth management and capital preservation strategies of Sitka Pacific.
I do weekly podcasts every Thursday on HoweStreet and a brief 7 minute segment on Saturday on CKNW AM 980 in Vancouver.
When not writing about stocks or the economy I spends a great deal of time on photography and in the garden. I have over 80 magazine and book cover credits. Some of my Wisconsin and gardening images can be seen at MichaelShedlock.com .
© 2009 Mike Shedlock, All Rights Reserved
Mike Shedlock Archive |
© 2005-2022 http://www.MarketOracle.co.uk - The Market Oracle is a FREE Daily Financial Markets Analysis & Forecasting online publication.