Gas and Electric Energy Bills Consumption and Tariffs Analysis
Personal_Finance / Money Saving Jun 23, 2009 - 05:29 PM GMTBy: MoneySupermarket
 Brits living in flats and terraced houses could be paying over the odds for their gas and electricity by not correctly identifying the best value energy product for their consumption, according to moneysupermarket.com.
- Cheapest provider varies according to your level of energy consumption, says moneysupermarket.com
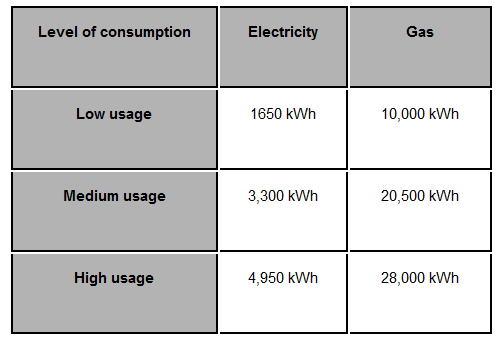
When it comes to choosing an energy tariff the majority of bill payers will choose from costs based on the average consumption of a medium house - 3,300 kWh of electricity and 20,500 kWh of gas. However, levels of use can vary greatly depending on the size of your home (see table below).
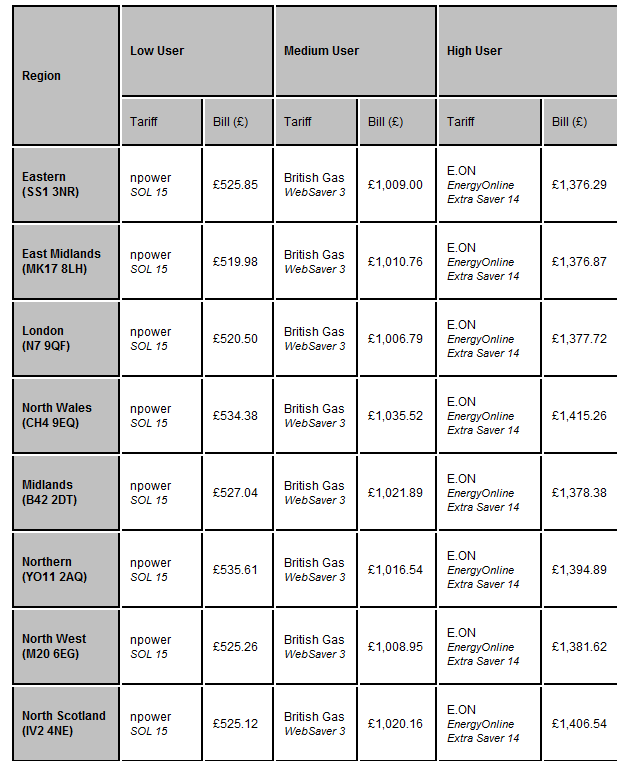
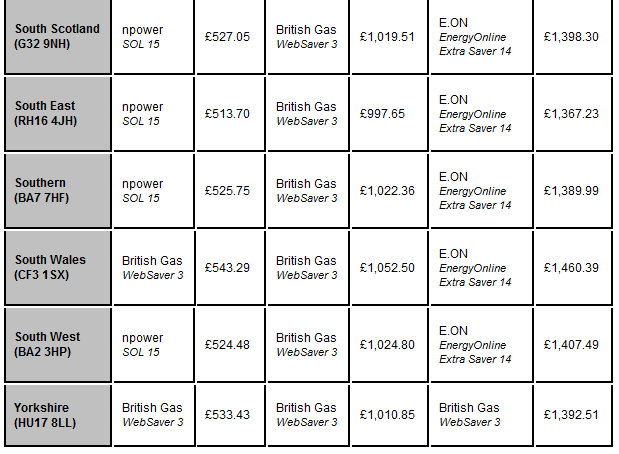
According to research from the price comparison site, British Gas WebSaver 3 is the cheapest product on the market in all of Britain's 14 regions for an 'average' house, with an average bill of £1,018 per year. However, for 'low' consumption bill payers, those living in flats or on their own for example, the SOL 15 tariff from npower offers the best value option for 12 regions with British Gas claiming the remaining two; an average cost of £527 a year. 'Low' consumption households could save as much as £172 a year on average by swapping from the incumbent tariff to the cheapest available1.
For households with higher consumption, for example a four bedroom family home, it's a different story completely - while British Gas is cheapest for the Yorkshire region, its E.ON's EnergyOnline Extra Saver 14 that snatches the top spot for the rest. The average bill for these customers comes in at £1,394 a year on average (see table below). These bill payers could see savings of £326 a year on average by moving from the incumbent to the average cheapest tariff available2.
Scott Byrom, utilities manager at moneysupermarket.com said: "The figures for an 'average' house are used in advertising and as the default numbers when comparing prices. So, if you don't know your typical energy usage, you may well choose a tariff that isn't the best deal for you and doesn't represent your household's consumption.
"For bill payers looking to swap their supplier to save cash as they emerge from this year's first round of price cuts3, it's important to remove the guess work and know exactly what your energy consumption has been over the past 12 months by looking at your bills - there are clearly savings to be made. If you don't have bills going back that far, phone your energy provider and ask for the historic details of your energy use.
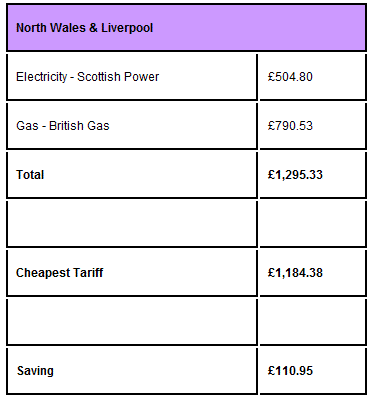
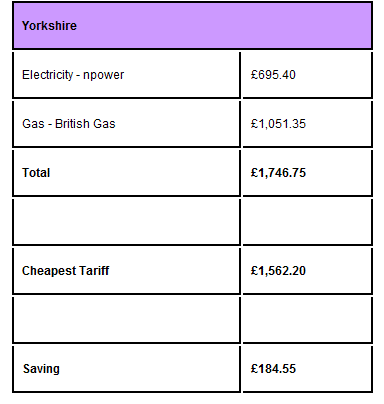
For those bill payers on standard tariffs, paying quarterly by cash or cheque, there are also savings to be made by ensuring you seek out the best tariff for your level of usage, and in most cases, move away from your incumbent provider. High consumption households in Yorkshire for example could save £185 a year by swapping from the incumbent provider (npower for electricity and British Gas for gas) to the cheapest alternative4.
Scott Byrom continued: "Its clear online tariffs remain the best deals on offer for Brits, no matter what your consumption. But whether you pay by monthly direct debit for an online tariff, or by quarterly cash or cheque for a standard deal, just because a provider is cheapest for your neighbour, it doesn't mean they'll be cheapest for you. I advise each person to evaluate their own situation and find the right tariff to cut the cost of their bill. Shopping around for the best energy deal is a quick way to make big savings".
Dual fuel tariffs from the UK's 'Big Six' for households with low, medium and high consumption1
Sourced by moneysupermarket.com/
Notes:
1Low consumption user (costs per year):
- Average incumbent tariff is £699.68
- Average cheapest tariff is £527.25
- Difference of £172.43
2High consumption user (costs per year):
- Average incumbent tariff is £1,721.22
- Average cheapest tariff is £1,394.53
- Difference of £326.68
32009 price cuts from the UK's 'Big Six' providers:
- Thursday, January 22, 2009 - British Gas cut gas prices by 10 per cent, effective 19 February 2009
- Friday, February 6, 2009 - Scottish & Southern cut electricity and gas prices by nine and four per cent respectively, effective 30 March 2009
- Thursday, February 12, 2009 - E.ON cut electricity prices by nine per cent, effective 31 March 2009
- Friday, February 13, 2009 - EDF Energy cut electricity prices by 8.8 per cent, effective 31 March 2009
- Friday, February 27, 2009 - ScottishPower cut gas and electricity prices by 7.5 and three per cent, effective 31 March 2009
- Monday, March 16, 2009 - npower cut electricity prices by 7.2 per cent, effective 31 March 2009
- Thursday, May 7, 2009 - British Gas cut electricity prices by 10 per cent, effective immediately
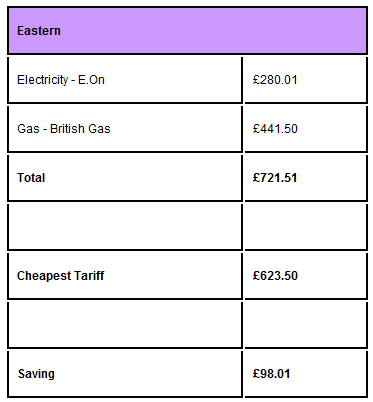
4Costs of QCC tariffs - and savings to be made - for different consumption households:
Medium consumption
High consumption:
Low consumption:
The Price Comparison Site
Disclaimer: The above is a matter of opinion provided for general information purposes only and is not intended as investment advice. Information and analysis above are derived from sources and utilising methods believed to be reliable, but we cannot accept responsibility for any losses you may incur as a result of this analysis. Individuals should consult with their personal financial advisors.
© 2005-2022 http://www.MarketOracle.co.uk - The Market Oracle is a FREE Daily Financial Markets Analysis & Forecasting online publication.


