


Stock Market History Repeats - Rhyming And Reason
Stock-Markets / Cycles Analysis Jun 22, 2009 - 11:47 AM GMTBy: Captain_Hook

 Will history repeat in terms of the widely followed stock market comparisons that many now put against present conditions. As you may know, often, when a system that is used to forecast financial markets becomes too popular, changes in outcomes occur despite previously tight correlations. And it could be argued we are at such a juncture now, as new services are cropping up everywhere in this regard. Still however, this does not preclude similarities being maintained, as despite speculator-induced differences that may be present today, these exercises are measurements in human behavioral extremes, which history has taught us generally tend to be bounded by similar measures.
The following is an excerpt from commentary that originally appeared at Treasure Chests for the benefit of subscribers on Tuesday, June 9th, 2009.
If this is the case, then, we should not only be able to observe similarities in previous pattern matches; but also, differences to allow for a better market / behavioral knowledge possessed by the present population of speculators. And in reviewing past mania sequences with similar traces and characteristics we in fact have such a situation, as you may know from previous analysis. Here, it was observed that although no conclusions could be absolute because speculator interest for the June index options were not know as of yet, it appeared most likely stocks should consolidate prior to heading higher.
And sure enough this is exactly what happened, only instead of lasting weeks or months, the consolidation lasted only days. You may remember this was because Goldman Sachs (and the other brokers subsequently) jammed stock market futures higher to provide a buoyant backdrop to help sell their own secondaries, which has worked out better than it should have for them. This is largely due to the idiot child in the White House who thinks nothing will come of his irresponsible policy, which will be his (and our) undoing in the end. You cannot spend government money like a hair-brained idiot on a shopping spree and not have people notice.
Certainly the bond market is taking notice, which will in the end likely be the catalyst for the next meltdown in the markets. However, it should be noted that history is telling us this might not be until the S&P 500 (SPX) trades above the large round number at 1,000. It should be noted that 1,000 is also the approximate 38.2% retrace off the decline lows at 666 (the sign of the devil), with the 50% measure coming in at approximately 1120. Now here is the rub in relation to the idea this recovery pattern may not be exact in relation to previous sequences, but it might rhyme, at least in magnitude. (See Figure 1)
Figure 1
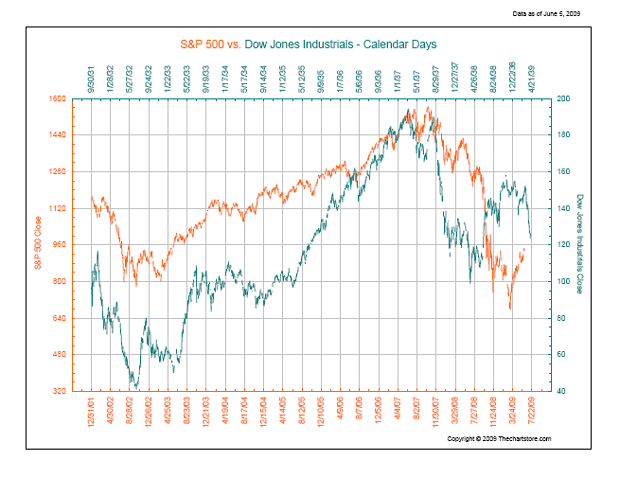
What I mean is if the stock market does not fall into a consolidation pattern immediately, then as per the US market (SPX) based historical analog comparison attached above (see Figure 1), no matter how you measure it, any pattern similarities will be broken. What’s more, this has been evident for some time already in the overlay measuring calendar days (as opposed to trading days) directly above, which bears little similarity in pattern past the initial decline witnessed in 2007. Of course there is another consideration worth noting however, and that is by now, back in the 30’s, stocks had already recovered 60% off their lows, which would put the SPX at approximately 1065. Moreover, it should be noted that the full recovery move in the post-crash Nikki patterning also calls for an approximate 60% move off the lows as well, albeit like the Dow’s 1937 to1938 sequence, a consolidation should take hold right here for a pattern match. (See Figure 2)
Figure 2
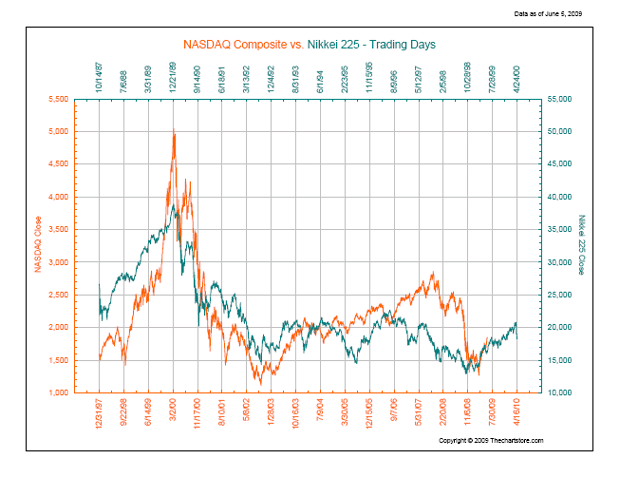
As you can see above, and as discussed previously, the pattern match between the post-crash Nikki and SPX is uncanny past the effects of Greenspan’s real estate bubble through the mid-2000’s, where we appear to be back on track now. Or are we? Because when you take a closer look, which can be seen below, the SPX appears to be going straight up (up 40% already), essentially having forgone any significant consolidation within its patterning off the lows at 666 to date. So you see, as far as pattern similarities go, we are quickly running past any degree of resemblance to historical comparison on our way to a calendar day magnitude match, as per Figure 1 above, which could take the SPX above 1,000 in fairly short order.
Unfortunately we cannot carry on past this point, as the remainder of this analysis is reserved for our subscribers. Of course if the above is the kind of analysis you are looking for this is easily remedied by visiting our continually improved web site to discover more about how our service can help you in not only this regard, but also in achieving your financial goals. For your information, our newly reconstructed site includes such improvements as automated subscriptions, improvements to trend identifying / professionally annotated charts, to the more detailed quote pages exclusively designed for independent investors who like to stay on top of things. Here, in addition to improving our advisory service, our aim is to also provide a resource center, one where you have access to well presented 'key' information concerning the markets we cover.
And if you have any questions, comments, or criticisms regarding the above, please feel free to drop us a line . We very much enjoy hearing from you on these matters.
Good investing all.
By Captain Hook
http://www.treasurechestsinfo.com/
Treasure Chests is a market timing service specializing in value-based position trading in the precious metals and equity markets with an orientation geared to identifying intermediate-term swing trading opportunities. Specific opportunities are identified utilizing a combination of fundamental, technical, and inter-market analysis. This style of investing has proven very successful for wealthy and sophisticated investors, as it reduces risk and enhances returns when the methodology is applied effectively. Those interested in discovering more about how the strategies described above can enhance your wealth should visit our web site at Treasure Chests
Disclaimer: The above is a matter of opinion and is not intended as investment advice. Information and analysis above are derived from sources and utilizing methods believed reliable, but we cannot accept responsibility for any trading losses you may incur as a result of this analysis. Comments within the text should not be construed as specific recommendations to buy or sell securities. Individuals should consult with their broker and personal financial advisors before engaging in any trading activities, as we are not registered brokers or advisors. Certain statements included herein may constitute "forward-looking statements" with the meaning of certain securities legislative measures. Such forward-looking statements involve known and unknown risks, uncertainties and other factors that may cause the actual results, performance or achievements of the above mentioned companies, and / or industry results, to be materially different from any future results, performance or achievements expressed or implied by such forward-looking statements. Do your own due diligence.
Copyright © 2009 treasurechests.info Inc. All rights reserved.
Unless otherwise indicated, all materials on these pages are copyrighted by treasurechests.info Inc. No part of these pages, either text or image may be used for any purpose other than personal use. Therefore, reproduction, modification, storage in a retrieval system or retransmission, in any form or by any means, electronic, mechanical or otherwise, for reasons other than personal use, is strictly prohibited without prior written permission.
Captain Hook Archive |
© 2005-2022 http://www.MarketOracle.co.uk - The Market Oracle is a FREE Daily Financial Markets Analysis & Forecasting online publication.