Silver Correction Over, Strongly Bullish Overall Pattern
Commodities / Gold & Silver 2009 Jun 22, 2009 - 12:38 AM GMTBy: Clive_Maund
 We are believed to be at a good entry point for silver here as the overall pattern is strongly bullish, and the predicted reaction of the past few weeks, which has served to unwind the earlier overbought condition, is now thought to have run its course.

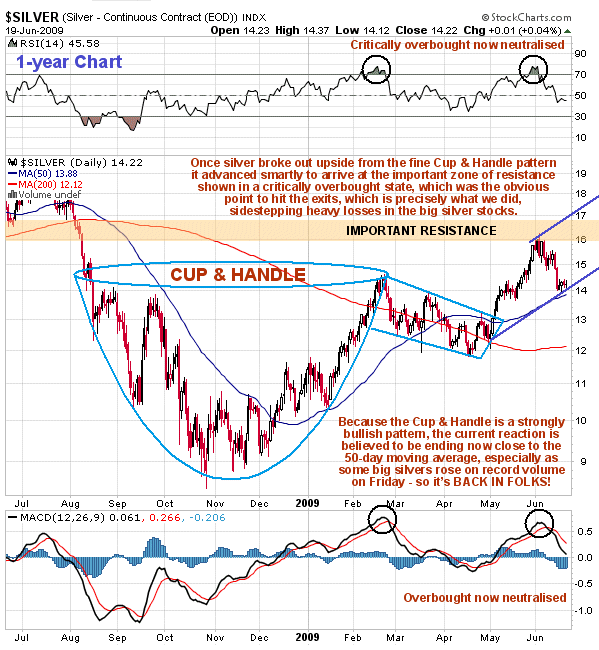
On the 1-year chart we can see that after breaking out of the strongly bullish fine Cup & Handle pattern, silver made a fairly rapid run at the important resistance level in the $16.00 - $16.80 zone, arriving there in a critically overbought condition, as shown by the RSI indicator at the top of the chart, so it is hardly surprising that it has reacted back over the past several weeks. We anticipated this reaction and sidestepped it , which is just as well as we can now buy back both silver and big silver stocks, some of which are about 25% cheaper after the reaction. In the last update the reaction was expected to terminate in the vicinity of the 50-day moving average, which silver is close to now, or at a trendline drawn from the October lows, which is not shown on this chart as it creates too much clutter, but was shown on a 2-year chart in the last update.
This trendline is now at about $13.50. However, on Friday the big silvers rose on huge volume - record volume in the case of some of them - and this is believed to be evidence of Smart Money piling in ahead of a new uptrend. For this reason the downtrend in silver is thought to have ended and it is rated an immediate buy, even and especially if it dips early next week. Note that the uptrend channel drawn from the early May low is still provisional and may require adjustment depending on whether we have already arrived at the final low.

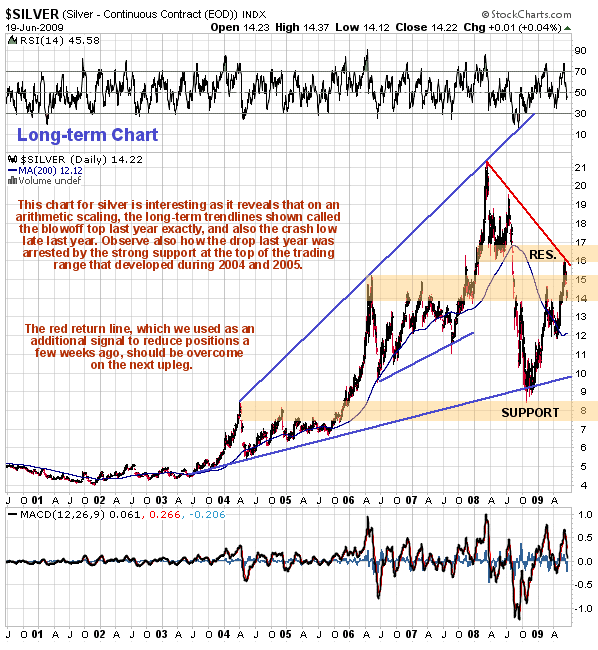
The long-term arithmetic chart for silver going back to the start of the bullmarket is interesting as it shows that two very long-term trendlines gave targets for the blowoff top early last year and also the crash low point that followed late in the year. Observe also how silver bottomed late last year just above a zone of important support dating back to the extensive trading in the long 2004 - 2005 trading range. Finally the red downtrend line shown was a tool used in the last update to call the recent top. This downtrend line should be overcome by the next upleg.
By Clive Maund
CliveMaund.com
For billing & subscription questions: subscriptions@clivemaund.com
© 2009 Clive Maund - The above represents the opinion and analysis of Mr. Maund, based on data available to him, at the time of writing. Mr. Maunds opinions are his own, and are not a recommendation or an offer to buy or sell securities. No responsibility can be accepted for losses that may result as a consequence of trading on the basis of this analysis.
Mr. Maund is an independent analyst who receives no compensation of any kind from any groups, individuals or corporations mentioned in his reports. As trading and investing in any financial markets may involve serious risk of loss, Mr. Maund recommends that you consult with a qualified investment advisor, one licensed by appropriate regulatory agencies in your legal jurisdiction and do your own due diligence and research when making any kind of a transaction with financial ramifications.
Clive Maund Archive |
© 2005-2022 http://www.MarketOracle.co.uk - The Market Oracle is a FREE Daily Financial Markets Analysis & Forecasting online publication.


