Stock Market Fundamental and Technical Indicators Convergence
Stock-Markets / Stock Index Trading Jun 21, 2009 - 07:15 PM GMTBy: Richard_Shaw
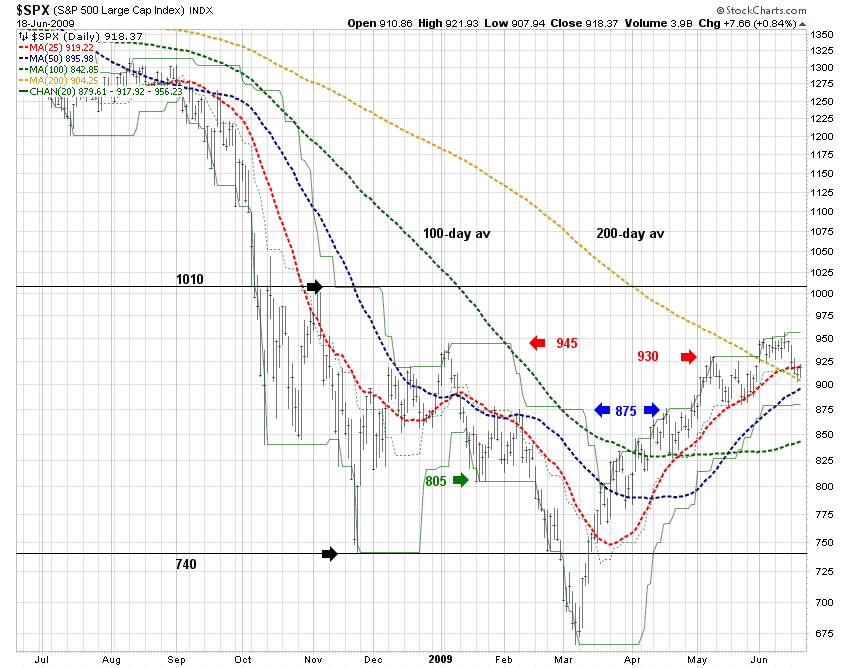
 It is interesting to see how close the institutional S&P 500 forecasts for 2009 come to the price level possibilities suggested by the S&P 500 chart. Maybe fundamentals and technicals are converging on an idea, or maybe the institutions use technical indicators more than one might expect.

This chart of S&P 500 rather readily suggests a range of around 750 to 1,000 for the S&P, and also a possible retracement level of about 800. Those numbers are not too different from the range of forecasts put out by the big boys.
On the chart, the 750 and 1,000 levels could be seen as significant resistance and support levels, and 800 could be seen as a likely 50% retracement from the recent high to the March low.
Those same price levels correspond generally to the forecasts presented in terms of various multiples times “operating” and “as reported” earnings forecasts put out by the brand name investment managers.
Here are the institutional forecasts that we published in a recent article:
Institutional Estimates:
Goldman this week stated an expectation of 950 to 1050 for 2009
Marc Faber predicts a possible run up to 1000 to 1050 by July with a near-term retracement that will not go below 800.
Meryl Witmer thinks the market is just about right now. Archie McAllaster thinks the market is cheap at its current level.
Alan Abelson, editor of Barron’s, thinks the valuation is too high, and like Fred Hickey believes a selloff is in the offing, because the fundamentals don’t support the price level.
Deutche Bank predicts 1060 by year-end, while JP Morgan Chase is close to that predicting 1100 for 2009.
Morgan Stanley sees not much value above 825 to 850.
Barclay’s (older estimate from April 17) predicted 757 for 2009 year-end.
HSBC forecasts 900 for year-end 2009
Sidebar:
Talking fundamentals and technicals is like talking religion or politics. It tends to enrage some people on both sides, and this article will undoubtedly generate a small number of strongly worded objections and condemnation. However, we gotta say what we gotta say. We think fundamentals and technicals complement one another. Each has strengths and each has weaknesses, and each has roles in a process. We use both.
You need to know what you want to buy, why you want to buy it, how much of it you should own (all fundamental matters), but then own it when its going up, and not own it when its going down (technical matters).
The fundamental and technical criteria and limits for each investor vary considerably, but our experience is that regardless of declared “religion” fundamental investors consult charts to some degree, and technical investors consult fundamental factors to some degree. Few investors, if any, purely use only fundamental information without some amount of looking at charts, or purely use charts without some study of market level or issue level fundamentals.
Our Prediction:
We are in the camp that says there we are more likely to see a retracement than a significant continuation of the rally (for both fundamental and technical reasons), and that if the rally continues it has less upside before a retracement than a retracement has downside. Time will tell.
By Richard Shaw
http://www.qvmgroup.com
Richard Shaw leads the QVM team as President of QVM Group. Richard has extensive investment industry experience including serving on the board of directors of two large investment management companies, including Aberdeen Asset Management (listed London Stock Exchange) and as a charter investor and director of Lending Tree ( download short professional profile ). He provides portfolio design and management services to individual and corporate clients. He also edits the QVM investment blog. His writings are generally republished by SeekingAlpha and Reuters and are linked to sites such as Kiplinger and Yahoo Finance and other sites. He is a 1970 graduate of Dartmouth College.
Copyright 2006-2009 by QVM Group LLC All rights reserved.
Disclaimer: The above is a matter of opinion and is not intended as investment advice. Information and analysis above are derived from sources and utilizing methods believed reliable, but we cannot accept responsibility for any trading losses you may incur as a result of this analysis. Do your own due diligence.
Richard Shaw Archive |
© 2005-2022 http://www.MarketOracle.co.uk - The Market Oracle is a FREE Daily Financial Markets Analysis & Forecasting online publication.


